m6id.large by Amazon Web Services
Geekbench is a cross-platform processor benchmark with a scoring system that determines single-core and multi-core performance using loads simulating real-world scenarios. Geekbench 5 score is calculated with a reference score of 2500 representing the performance of the Intel Core i5-2520M @ 2.50 GHz. The software benchmark is available for Mac OS, Windows, Linux, Android and iOS platforms.
Specifications:
CPU
2
RAM
8.0 GB
Extra
1x
118 GB
SSD
Net
12000 Mbps
{
"configuration": {
"chart": {
"type": "scatter",
"polar": false,
"zoomType": "",
"options3d": {},
"height": null,
"width": null,
"margin": null,
"inverted": false,
"zooming": {}
},
"credits": {
"enabled": false
},
"title": {
"text": ""
},
"colorAxis": null,
"subtitle": {
"text": ""
},
"xAxis": {
"title": {
"text": [
"Single Score"
],
"useHTML": false,
"style": {
"color": "#666666"
}
},
"categories": null,
"lineWidth": 1,
"tickInterval": null,
"tickWidth": 1,
"tickLength": 10,
"tickPixelInterval": 100,
"plotLines": null,
"labels": {
"enabled": true,
"format": null,
"formatter": "",
"style": {
"color": "#666666",
"cursor": "default",
"fontSize": "11px"
},
"useHTML": false,
"step": 0
},
"plotBands": null,
"visible": true,
"floor": null,
"ceiling": null,
"type": "linear",
"min": 0,
"gridLineWidth": 1,
"gridLineColor": "#e6e6e6",
"minorTickInterval": null,
"minorTickWidth": 0,
"minTickInterval": null,
"startOnTick": true,
"endOnTick": true,
"tickmarkPlacement": 100,
"units": 100,
"minRange": 100
},
"yAxis": {
"title": {
"text": [
"Multi Score"
],
"useHTML": false,
"style": {
"color": "#666666"
}
},
"categories": null,
"plotLines": null,
"plotBands": null,
"lineWidth": null,
"tickInterval": null,
"tickLength": 10,
"floor": null,
"ceiling": null,
"gridLineInterpolation": null,
"gridLineWidth": 1,
"gridLineColor": "#e6e6e6",
"min": 0,
"max": null,
"minorTickInterval": null,
"minorTickWidth": 0,
"minTickInterval": null,
"startOnTick": true,
"endOnTick": true,
"minRange": null,
"type": "linear",
"tickmarkPlacement": null,
"labels": {
"enabled": true,
"formatter": null,
"style": {
"color": "#666666",
"cursor": "default",
"fontSize": "11px"
},
"useHTML": false
}
},
"zAxis": {
"title": {
"text": "Multi Score"
}
},
"plotOptions": {
"series": {
"dataLabels": {
"enabled": false,
"format": null,
"distance": 30,
"align": "center",
"inside": null,
"allowOverlap": false,
"style": {
"fontSize": "11px"
}
},
"showInLegend": null,
"turboThreshold": 0,
"stacking": "",
"groupPadding": 0.2,
"centerInCategory": false,
"findNearestPointBy": "x"
}
},
"navigator": {
"enabled": false
},
"scrollbar": {
"enabled": false
},
"rangeSelector": {
"enabled": false,
"inputEnabled": false
},
"legend": {
"enabled": null,
"maxHeight": null,
"align": "center",
"verticalAlign": "bottom",
"layout": "horizontal",
"width": null,
"margin": 12,
"reversed": false
},
"series": [
{
"name": "m6id.large by Amazon Web Services",
"color": "#f7981d",
"data": [
{
"x": 1195.1851649372502,
"y": 1399.1414928354732
},
{
"x": 1149.6507167375134,
"y": 1368.1694459129362
},
{
"x": 1203.5843941272328,
"y": 1395.6159696422892
},
{
"x": 1173.718191479468,
"y": 1378.0922736104983
},
{
"x": 1192.6961375707024,
"y": 1400.2791155155035
},
{
"x": 1165.0010549213187,
"y": 1362.0639314934924
},
{
"x": 1205.85071792617,
"y": 1397.6025374402711
},
{
"x": 1132.8641385564947,
"y": 1380.9776978840132
},
{
"x": 1201.8761390151903,
"y": 1409.3736707688765
},
{
"x": 1168.4615237618987,
"y": 1362.7651330559468
},
{
"x": 1193.3764543211485,
"y": 1410.4684546941753
},
{
"x": 1158.0315381447576,
"y": 1377.3831790928075
},
{
"x": 1196.3831254452389,
"y": 1401.3128579962636
},
{
"x": 1166.3349366643627,
"y": 1367.0379820915168
},
{
"x": 1212.1071299048199,
"y": 1394.6006070964136
},
{
"x": 1175.9297100404983,
"y": 1386.0526275193918
},
{
"x": 1156.6069687983077,
"y": 1395.0309915556927
},
{
"x": 1175.9497557137088,
"y": 1373.4061423193461
},
{
"x": 1194.4636201883554,
"y": 1402.5556415980477
},
{
"x": 1160.852974784071,
"y": 1357.078103406989
}
]
}
],
"drilldown": {},
"tooltip": {
"enabled": true,
"useHTML": false,
"format": null,
"headerFormat": "",
"pointFormat": "<span style=\"color:{series.color}\">Single</span>: <b>{point.x:.0f}</b><br><span style=\"color:{series.color}\">Multi</span>: <b>{point.y:.0f}</b>",
"footerFormat": "",
"shared": false,
"outside": false,
"valueDecimals": null,
"split": false
},
"annotations": null
},
"hc_type": "chart",
"id": "103568374656355957121267386231853640237"
}
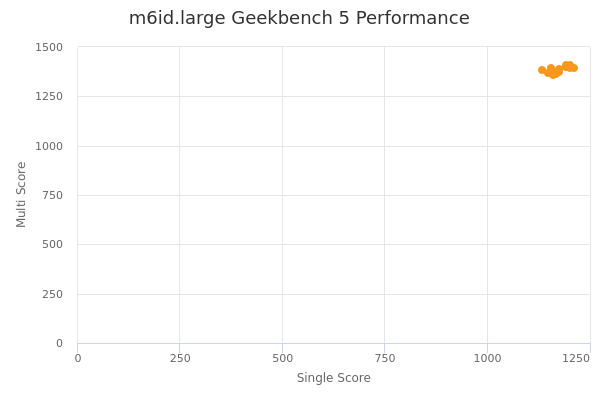
| Single | Multi | |
|---|---|---|
| Max | 1212 | 1410 |
| Average | 1179 | 1386 |
| Deviation | 21.11 | 16.37 |
| Min | 1133 | 1357 |
Sign up as Freemium to get more insight.