m6id.4xlarge by Amazon Web Services
Geekbench is a cross-platform processor benchmark with a scoring system that determines single-core and multi-core performance using loads simulating real-world scenarios. Geekbench 5 score is calculated with a reference score of 2500 representing the performance of the Intel Core i5-2520M @ 2.50 GHz. The software benchmark is available for Mac OS, Windows, Linux, Android and iOS platforms.
Specifications:
CPU
16
RAM
64.0 GB
Extra
1x
950 GB
SSD
Net
12000 Mbps
{
"configuration": {
"chart": {
"type": "scatter",
"polar": false,
"zoomType": "",
"options3d": {},
"height": null,
"width": null,
"margin": null,
"inverted": false,
"zooming": {}
},
"credits": {
"enabled": false
},
"title": {
"text": ""
},
"colorAxis": null,
"subtitle": {
"text": ""
},
"xAxis": {
"title": {
"text": [
"Single Score"
],
"useHTML": false,
"style": {
"color": "#666666"
}
},
"categories": null,
"lineWidth": 1,
"tickInterval": null,
"tickWidth": 1,
"tickLength": 10,
"tickPixelInterval": 100,
"plotLines": null,
"labels": {
"enabled": true,
"format": null,
"formatter": "",
"style": {
"color": "#666666",
"cursor": "default",
"fontSize": "11px"
},
"useHTML": false,
"step": 0
},
"plotBands": null,
"visible": true,
"floor": null,
"ceiling": null,
"type": "linear",
"min": 0,
"gridLineWidth": 1,
"gridLineColor": "#e6e6e6",
"minorTickInterval": null,
"minorTickWidth": 0,
"minTickInterval": null,
"startOnTick": true,
"endOnTick": true,
"tickmarkPlacement": 100,
"units": 100,
"minRange": 100
},
"yAxis": {
"title": {
"text": [
"Multi Score"
],
"useHTML": false,
"style": {
"color": "#666666"
}
},
"categories": null,
"plotLines": null,
"plotBands": null,
"lineWidth": null,
"tickInterval": null,
"tickLength": 10,
"floor": null,
"ceiling": null,
"gridLineInterpolation": null,
"gridLineWidth": 1,
"gridLineColor": "#e6e6e6",
"min": 0,
"max": null,
"minorTickInterval": null,
"minorTickWidth": 0,
"minTickInterval": null,
"startOnTick": true,
"endOnTick": true,
"minRange": null,
"type": "linear",
"tickmarkPlacement": null,
"labels": {
"enabled": true,
"formatter": null,
"style": {
"color": "#666666",
"cursor": "default",
"fontSize": "11px"
},
"useHTML": false
}
},
"zAxis": {
"title": {
"text": "Multi Score"
}
},
"plotOptions": {
"series": {
"dataLabels": {
"enabled": false,
"format": null,
"distance": 30,
"align": "center",
"inside": null,
"allowOverlap": false,
"style": {
"fontSize": "11px"
}
},
"showInLegend": null,
"turboThreshold": 0,
"stacking": "",
"groupPadding": 0.2,
"centerInCategory": false,
"findNearestPointBy": "x"
}
},
"navigator": {
"enabled": false
},
"scrollbar": {
"enabled": false
},
"rangeSelector": {
"enabled": false,
"inputEnabled": false
},
"legend": {
"enabled": null,
"maxHeight": null,
"align": "center",
"verticalAlign": "bottom",
"layout": "horizontal",
"width": null,
"margin": 12,
"reversed": false
},
"series": [
{
"name": "m6id.4xlarge by Amazon Web Services",
"color": "#f7981d",
"data": [
{
"x": 1236.2198516560002,
"y": 10111.05905889705
},
{
"x": 1213.5390245508443,
"y": 10056.539643121972
},
{
"x": 1227.8410161296888,
"y": 10047.8317254336
},
{
"x": 1212.064614764778,
"y": 10013.789183104522
},
{
"x": 1229.593444819436,
"y": 10093.430803758458
},
{
"x": 1212.8664885567075,
"y": 10002.966531867167
},
{
"x": 1226.756195417666,
"y": 10056.369839995838
},
{
"x": 1210.528328573832,
"y": 10044.260097739783
},
{
"x": 1231.4289701080934,
"y": 10081.704637833904
},
{
"x": 1223.6763844894313,
"y": 10061.425395742745
},
{
"x": 1233.987343979368,
"y": 10120.715608669454
},
{
"x": 1218.6933241581148,
"y": 9990.559229929746
},
{
"x": 1248.2922698738366,
"y": 10084.016354871907
},
{
"x": 1214.1391105196458,
"y": 10025.738732676942
},
{
"x": 1233.4639343343842,
"y": 10058.399801778087
},
{
"x": 1212.992278041842,
"y": 10039.537624164732
},
{
"x": 1228.0128621440708,
"y": 10074.037449946107
},
{
"x": 1229.0720159814127,
"y": 10027.073763621534
},
{
"x": 1235.5163103096527,
"y": 10102.413084785987
},
{
"x": 1208.4580031817388,
"y": 10054.83781566726
}
]
}
],
"drilldown": {},
"tooltip": {
"enabled": true,
"useHTML": false,
"format": null,
"headerFormat": "",
"pointFormat": "<span style=\"color:{series.color}\">Single</span>: <b>{point.x:.0f}</b><br><span style=\"color:{series.color}\">Multi</span>: <b>{point.y:.0f}</b>",
"footerFormat": "",
"shared": false,
"outside": false,
"valueDecimals": null,
"split": false
},
"annotations": null
},
"hc_type": "chart",
"id": "298981143485893179065333154658058085369"
}
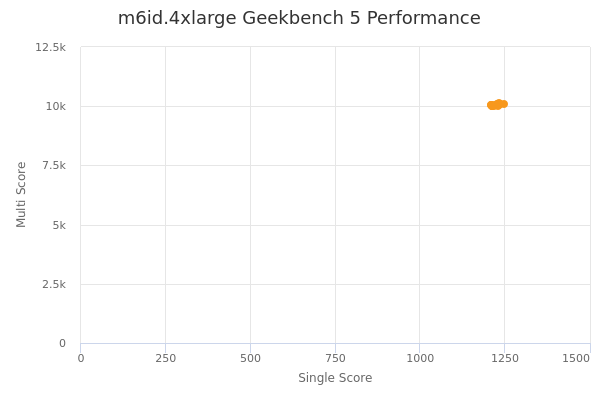
| Single | Multi | |
|---|---|---|
| Max | 1248 | 10121 |
| Average | 1224 | 10057 |
| Deviation | 10.62 | 34.39 |
| Min | 1208 | 9991 |
Sign up as Freemium to get more insight.