m6id.xlarge by Amazon Web Services
Geekbench is a cross-platform processor benchmark with a scoring system that determines single-core and multi-core performance using loads simulating real-world scenarios. Geekbench 5 score is calculated with a reference score of 2500 representing the performance of the Intel Core i5-2520M @ 2.50 GHz. The software benchmark is available for Mac OS, Windows, Linux, Android and iOS platforms.
Specifications:
CPU
4
RAM
16.0 GB
Extra
1x
237 GB
SSD
Net
12000 Mbps
{
"configuration": {
"chart": {
"type": "scatter",
"polar": false,
"zoomType": "",
"options3d": {},
"height": null,
"width": null,
"margin": null,
"inverted": false,
"zooming": {}
},
"credits": {
"enabled": false
},
"title": {
"text": ""
},
"colorAxis": null,
"subtitle": {
"text": ""
},
"xAxis": {
"title": {
"text": [
"Single Score"
],
"useHTML": false,
"style": {
"color": "#666666"
}
},
"categories": null,
"lineWidth": 1,
"tickInterval": null,
"tickWidth": 1,
"tickLength": 10,
"tickPixelInterval": 100,
"plotLines": null,
"labels": {
"enabled": true,
"format": null,
"formatter": "",
"style": {
"color": "#666666",
"cursor": "default",
"fontSize": "11px"
},
"useHTML": false,
"step": 0
},
"plotBands": null,
"visible": true,
"floor": null,
"ceiling": null,
"type": "linear",
"min": 0,
"gridLineWidth": 1,
"gridLineColor": "#e6e6e6",
"minorTickInterval": null,
"minorTickWidth": 0,
"minTickInterval": null,
"startOnTick": true,
"endOnTick": true,
"tickmarkPlacement": 100,
"units": 100,
"minRange": 100
},
"yAxis": {
"title": {
"text": [
"Multi Score"
],
"useHTML": false,
"style": {
"color": "#666666"
}
},
"categories": null,
"plotLines": null,
"plotBands": null,
"lineWidth": null,
"tickInterval": null,
"tickLength": 10,
"floor": null,
"ceiling": null,
"gridLineInterpolation": null,
"gridLineWidth": 1,
"gridLineColor": "#e6e6e6",
"min": 0,
"max": null,
"minorTickInterval": null,
"minorTickWidth": 0,
"minTickInterval": null,
"startOnTick": true,
"endOnTick": true,
"minRange": null,
"type": "linear",
"tickmarkPlacement": null,
"labels": {
"enabled": true,
"formatter": null,
"style": {
"color": "#666666",
"cursor": "default",
"fontSize": "11px"
},
"useHTML": false
}
},
"zAxis": {
"title": {
"text": "Multi Score"
}
},
"plotOptions": {
"series": {
"dataLabels": {
"enabled": false,
"format": null,
"distance": 30,
"align": "center",
"inside": null,
"allowOverlap": false,
"style": {
"fontSize": "11px"
}
},
"showInLegend": null,
"turboThreshold": 0,
"stacking": "",
"groupPadding": 0.2,
"centerInCategory": false,
"findNearestPointBy": "x"
}
},
"navigator": {
"enabled": false
},
"scrollbar": {
"enabled": false
},
"rangeSelector": {
"enabled": false,
"inputEnabled": false
},
"legend": {
"enabled": null,
"maxHeight": null,
"align": "center",
"verticalAlign": "bottom",
"layout": "horizontal",
"width": null,
"margin": 12,
"reversed": false
},
"series": [
{
"name": "m6id.xlarge by Amazon Web Services",
"color": "#f7981d",
"data": [
{
"x": 1219.3171492471067,
"y": 2785.81945195381
},
{
"x": 1210.3036813677536,
"y": 2773.4747577543917
},
{
"x": 1185.23058323639,
"y": 2787.126719227783
},
{
"x": 1197.1198265291741,
"y": 2742.8883517708127
},
{
"x": 1224.889081546911,
"y": 2784.7620813003987
},
{
"x": 1196.9592432037234,
"y": 2752.510742640876
},
{
"x": 1220.4097429840244,
"y": 2777.9216628510685
},
{
"x": 1201.6818791840383,
"y": 2743.302871280123
},
{
"x": 1212.5134761151244,
"y": 2781.797276707328
},
{
"x": 1216.001749965654,
"y": 2750.3958270115386
},
{
"x": 1220.0874474450584,
"y": 2789.463616927621
},
{
"x": 1210.3967176159997,
"y": 2744.38401240021
},
{
"x": 1228.321974728954,
"y": 2780.9898306156647
},
{
"x": 1202.1099183752053,
"y": 2771.8696457051233
},
{
"x": 1229.0468659771632,
"y": 2785.67830371568
},
{
"x": 1206.960656393907,
"y": 2761.3070162299973
},
{
"x": 1220.9053724732041,
"y": 2767.786561354005
},
{
"x": 1202.6248358424969,
"y": 2755.1475849505878
},
{
"x": 1226.1174238315136,
"y": 2777.1941907902774
},
{
"x": 1224.3025416155135,
"y": 2777.1238498781163
}
]
}
],
"drilldown": {},
"tooltip": {
"enabled": true,
"useHTML": false,
"format": null,
"headerFormat": "",
"pointFormat": "<span style=\"color:{series.color}\">Single</span>: <b>{point.x:.0f}</b><br><span style=\"color:{series.color}\">Multi</span>: <b>{point.y:.0f}</b>",
"footerFormat": "",
"shared": false,
"outside": false,
"valueDecimals": null,
"split": false
},
"annotations": null
},
"hc_type": "chart",
"id": "300262404340609981050980623110883910891"
}
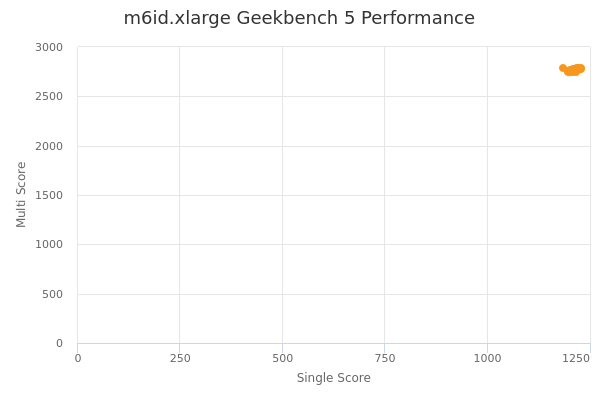
| Single | Multi | |
|---|---|---|
| Max | 1229 | 2789 |
| Average | 1213 | 2770 |
| Deviation | 11.91 | 15.68 |
| Min | 1185 | 2743 |
Sign up as Freemium to get more insight.