m6id.2xlarge by Amazon Web Services
Geekbench is a cross-platform processor benchmark with a scoring system that determines single-core and multi-core performance using loads simulating real-world scenarios. Geekbench 5 score is calculated with a reference score of 2500 representing the performance of the Intel Core i5-2520M @ 2.50 GHz. The software benchmark is available for Mac OS, Windows, Linux, Android and iOS platforms.
Specifications:
CPU
8
RAM
32.0 GB
Extra
1x
474 GB
SSD
Net
12000 Mbps
{
"configuration": {
"chart": {
"type": "scatter",
"polar": false,
"zoomType": "",
"options3d": {},
"height": null,
"width": null,
"margin": null,
"inverted": false,
"zooming": {}
},
"credits": {
"enabled": false
},
"title": {
"text": ""
},
"colorAxis": null,
"subtitle": {
"text": ""
},
"xAxis": {
"title": {
"text": [
"Single Score"
],
"useHTML": false,
"style": {
"color": "#666666"
}
},
"categories": null,
"lineWidth": 1,
"tickInterval": null,
"tickWidth": 1,
"tickLength": 10,
"tickPixelInterval": 100,
"plotLines": null,
"labels": {
"enabled": true,
"format": null,
"formatter": "",
"style": {
"color": "#666666",
"cursor": "default",
"fontSize": "11px"
},
"useHTML": false,
"step": 0
},
"plotBands": null,
"visible": true,
"floor": null,
"ceiling": null,
"type": "linear",
"min": 0,
"gridLineWidth": 1,
"gridLineColor": "#e6e6e6",
"minorTickInterval": null,
"minorTickWidth": 0,
"minTickInterval": null,
"startOnTick": true,
"endOnTick": true,
"tickmarkPlacement": 100,
"units": 100,
"minRange": 100
},
"yAxis": {
"title": {
"text": [
"Multi Score"
],
"useHTML": false,
"style": {
"color": "#666666"
}
},
"categories": null,
"plotLines": null,
"plotBands": null,
"lineWidth": null,
"tickInterval": null,
"tickLength": 10,
"floor": null,
"ceiling": null,
"gridLineInterpolation": null,
"gridLineWidth": 1,
"gridLineColor": "#e6e6e6",
"min": 0,
"max": null,
"minorTickInterval": null,
"minorTickWidth": 0,
"minTickInterval": null,
"startOnTick": true,
"endOnTick": true,
"minRange": null,
"type": "linear",
"tickmarkPlacement": null,
"labels": {
"enabled": true,
"formatter": null,
"style": {
"color": "#666666",
"cursor": "default",
"fontSize": "11px"
},
"useHTML": false
}
},
"zAxis": {
"title": {
"text": "Multi Score"
}
},
"plotOptions": {
"series": {
"dataLabels": {
"enabled": false,
"format": null,
"distance": 30,
"align": "center",
"inside": null,
"allowOverlap": false,
"style": {
"fontSize": "11px"
}
},
"showInLegend": null,
"turboThreshold": 0,
"stacking": "",
"groupPadding": 0.2,
"centerInCategory": false,
"findNearestPointBy": "x"
}
},
"navigator": {
"enabled": false
},
"scrollbar": {
"enabled": false
},
"rangeSelector": {
"enabled": false,
"inputEnabled": false
},
"legend": {
"enabled": null,
"maxHeight": null,
"align": "center",
"verticalAlign": "bottom",
"layout": "horizontal",
"width": null,
"margin": 12,
"reversed": false
},
"series": [
{
"name": "m6id.2xlarge by Amazon Web Services",
"color": "#f7981d",
"data": [
{
"x": 1248.3603461724367,
"y": 5387.996656636711
},
{
"x": 1217.6378164885089,
"y": 5343.390602925031
},
{
"x": 1186.6026295637855,
"y": 5321.806580624514
},
{
"x": 1206.0739622674616,
"y": 5344.337307130218
},
{
"x": 1226.354315985555,
"y": 5388.237984623984
},
{
"x": 1223.3489847040382,
"y": 5329.742781092651
},
{
"x": 1243.6882316095175,
"y": 5376.746905044695
},
{
"x": 1211.2667180359445,
"y": 5343.5878016695815
},
{
"x": 1238.6230011429057,
"y": 5394.125027289759
},
{
"x": 1224.0086823263364,
"y": 5348.439648836591
},
{
"x": 1230.702522201914,
"y": 5393.335062354343
},
{
"x": 1215.8930116358947,
"y": 5343.291362841119
},
{
"x": 1235.8574676862863,
"y": 5390.90661338274
},
{
"x": 1214.477688578571,
"y": 5341.034501533991
},
{
"x": 1241.6160176635167,
"y": 5389.499109460885
},
{
"x": 1216.0380844273498,
"y": 5345.503566278472
},
{
"x": 1243.234877219504,
"y": 5370.6343699537965
},
{
"x": 1220.3682404635845,
"y": 5340.318115272865
},
{
"x": 1232.4622003584154,
"y": 5363.9607907490645
},
{
"x": 1216.4544879088385,
"y": 5330.359409994963
},
{
"x": 1141.9392691243447,
"y": 5096.0657931404185
},
{
"x": 1086.266284364394,
"y": 4864.551206929625
},
{
"x": 1150.280003400583,
"y": 5091.094821479917
},
{
"x": 1087.8055035460227,
"y": 4899.673176531345
},
{
"x": 1147.6168680967796,
"y": 5114.145986912535
},
{
"x": 1094.3775317852924,
"y": 4926.869121472988
}
]
}
],
"drilldown": {},
"tooltip": {
"enabled": true,
"useHTML": false,
"format": null,
"headerFormat": "",
"pointFormat": "<span style=\"color:{series.color}\">Single</span>: <b>{point.x:.0f}</b><br><span style=\"color:{series.color}\">Multi</span>: <b>{point.y:.0f}</b>",
"footerFormat": "",
"shared": false,
"outside": false,
"valueDecimals": null,
"split": false
},
"annotations": null
},
"hc_type": "chart",
"id": "257731018712592809626106455404591340871"
}
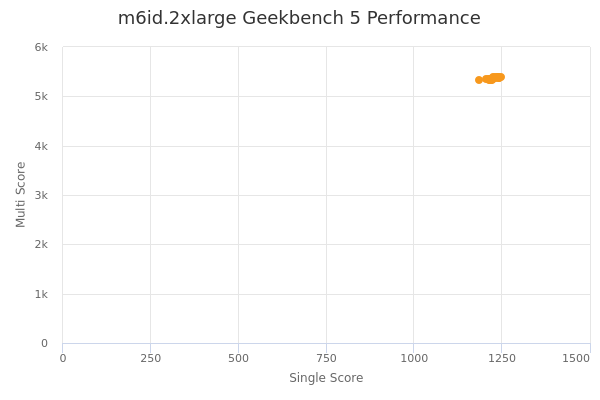
| Single | Multi | |
|---|---|---|
| Max | 1248 | 5394 |
| Average | 1200 | 5276 |
| Deviation | 48.74 | 161.25 |
| Min | 1086 | 4865 |
Sign up as Freemium to get more insight.