m6id.metal by Amazon Web Services
Geekbench is a cross-platform processor benchmark with a scoring system that determines single-core and multi-core performance using loads simulating real-world scenarios. Geekbench 5 score is calculated with a reference score of 2500 representing the performance of the Intel Core i5-2520M @ 2.50 GHz. The software benchmark is available for Mac OS, Windows, Linux, Android and iOS platforms.
Specifications:
CPU
128
RAM
512.0 GB
Extra
4x
1900 GB
SSD
Net
50000 Mbps
{
"configuration": {
"chart": {
"type": "scatter",
"polar": false,
"zoomType": "",
"options3d": {},
"height": null,
"width": null,
"margin": null,
"inverted": false,
"zooming": {}
},
"credits": {
"enabled": false
},
"title": {
"text": ""
},
"colorAxis": null,
"subtitle": {
"text": ""
},
"xAxis": {
"title": {
"text": [
"Single Score"
],
"useHTML": false,
"style": {
"color": "#666666"
}
},
"categories": null,
"lineWidth": 1,
"tickInterval": null,
"tickWidth": 1,
"tickLength": 10,
"tickPixelInterval": 100,
"plotLines": null,
"labels": {
"enabled": true,
"format": null,
"formatter": "",
"style": {
"color": "#666666",
"cursor": "default",
"fontSize": "11px"
},
"useHTML": false,
"step": 0
},
"plotBands": null,
"visible": true,
"floor": null,
"ceiling": null,
"type": "linear",
"min": 0,
"gridLineWidth": 1,
"gridLineColor": "#e6e6e6",
"minorTickInterval": null,
"minorTickWidth": 0,
"minTickInterval": null,
"startOnTick": true,
"endOnTick": true,
"tickmarkPlacement": 100,
"units": 100,
"minRange": 100
},
"yAxis": {
"title": {
"text": [
"Multi Score"
],
"useHTML": false,
"style": {
"color": "#666666"
}
},
"categories": null,
"plotLines": null,
"plotBands": null,
"lineWidth": null,
"tickInterval": null,
"tickLength": 10,
"floor": null,
"ceiling": null,
"gridLineInterpolation": null,
"gridLineWidth": 1,
"gridLineColor": "#e6e6e6",
"min": 0,
"max": null,
"minorTickInterval": null,
"minorTickWidth": 0,
"minTickInterval": null,
"startOnTick": true,
"endOnTick": true,
"minRange": null,
"type": "linear",
"tickmarkPlacement": null,
"labels": {
"enabled": true,
"formatter": null,
"style": {
"color": "#666666",
"cursor": "default",
"fontSize": "11px"
},
"useHTML": false
}
},
"zAxis": {
"title": {
"text": "Multi Score"
}
},
"plotOptions": {
"series": {
"dataLabels": {
"enabled": false,
"format": null,
"distance": 30,
"align": "center",
"inside": null,
"allowOverlap": false,
"style": {
"fontSize": "11px"
}
},
"showInLegend": null,
"turboThreshold": 0,
"stacking": "",
"groupPadding": 0.2,
"centerInCategory": false,
"findNearestPointBy": "x"
}
},
"navigator": {
"enabled": false
},
"scrollbar": {
"enabled": false
},
"rangeSelector": {
"enabled": false,
"inputEnabled": false
},
"legend": {
"enabled": null,
"maxHeight": null,
"align": "center",
"verticalAlign": "bottom",
"layout": "horizontal",
"width": null,
"margin": 12,
"reversed": false
},
"series": [
{
"name": "m6id.metal by Amazon Web Services",
"color": "#f7981d",
"data": [
{
"x": 1271.7517830262589,
"y": 53118.70150827771
},
{
"x": 1276.7782692930973,
"y": 53007.69042910435
},
{
"x": 1276.6332650634063,
"y": 53079.4468663039
},
{
"x": 1260.1577375649774,
"y": 53777.03344973367
},
{
"x": 1271.8931629049716,
"y": 53141.50008483812
},
{
"x": 1261.1154985824767,
"y": 53251.917772828405
},
{
"x": 1274.3015502309042,
"y": 52931.414621840944
},
{
"x": 1265.532017968079,
"y": 53437.190257916955
},
{
"x": 1277.2463793375248,
"y": 52370.95992965061
},
{
"x": 1259.9478933472308,
"y": 52640.80089183632
},
{
"x": 1260.514740271783,
"y": 54105.3522490907
},
{
"x": 1272.752417100312,
"y": 53017.28493647149
},
{
"x": 1278.1854297380166,
"y": 53278.660931772945
},
{
"x": 1260.967877559468,
"y": 52104.85356446232
},
{
"x": 1276.406873807254,
"y": 52326.011699506846
},
{
"x": 1260.6126094867104,
"y": 53320.0757240691
},
{
"x": 1275.2864703322632,
"y": 52204.41393163289
},
{
"x": 1265.9197822486876,
"y": 52703.310294940646
},
{
"x": 1276.6206345461344,
"y": 52442.40390046076
},
{
"x": 1273.1386670012512,
"y": 54018.29191261424
}
]
}
],
"drilldown": {},
"tooltip": {
"enabled": true,
"useHTML": false,
"format": null,
"headerFormat": "",
"pointFormat": "<span style=\"color:{series.color}\">Single</span>: <b>{point.x:.0f}</b><br><span style=\"color:{series.color}\">Multi</span>: <b>{point.y:.0f}</b>",
"footerFormat": "",
"shared": false,
"outside": false,
"valueDecimals": null,
"split": false
},
"annotations": null
},
"hc_type": "chart",
"id": "283516751862266472305659633446254680154"
}
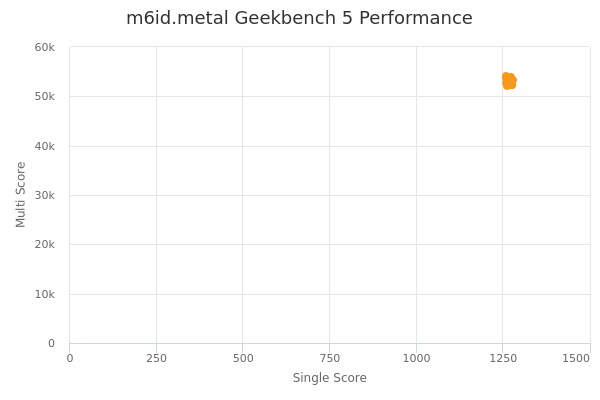
| Single | Multi | |
|---|---|---|
| Max | 1278 | 54105 |
| Average | 1270 | 53014 |
| Deviation | 6.85 | 554.57 |
| Min | 1260 | 52105 |
Sign up as Freemium to get more insight.