m6id.32xlarge by Amazon Web Services
Geekbench is a cross-platform processor benchmark with a scoring system that determines single-core and multi-core performance using loads simulating real-world scenarios. Geekbench 5 score is calculated with a reference score of 2500 representing the performance of the Intel Core i5-2520M @ 2.50 GHz. The software benchmark is available for Mac OS, Windows, Linux, Android and iOS platforms.
Specifications:
CPU
128
RAM
512.0 GB
Extra
4x
1900 GB
SSD
Net
50000 Mbps
{
"configuration": {
"chart": {
"type": "scatter",
"polar": false,
"zoomType": "",
"options3d": {},
"height": null,
"width": null,
"margin": null,
"inverted": false,
"zooming": {}
},
"credits": {
"enabled": false
},
"title": {
"text": ""
},
"colorAxis": null,
"subtitle": {
"text": ""
},
"xAxis": {
"title": {
"text": [
"Single Score"
],
"useHTML": false,
"style": {
"color": "#666666"
}
},
"categories": null,
"lineWidth": 1,
"tickInterval": null,
"tickWidth": 1,
"tickLength": 10,
"tickPixelInterval": 100,
"plotLines": null,
"labels": {
"enabled": true,
"format": null,
"formatter": "",
"style": {
"color": "#666666",
"cursor": "default",
"fontSize": "11px"
},
"useHTML": false,
"step": 0
},
"plotBands": null,
"visible": true,
"floor": null,
"ceiling": null,
"type": "linear",
"min": 0,
"gridLineWidth": 1,
"gridLineColor": "#e6e6e6",
"minorTickInterval": null,
"minorTickWidth": 0,
"minTickInterval": null,
"startOnTick": true,
"endOnTick": true,
"tickmarkPlacement": 100,
"units": 100,
"minRange": 100
},
"yAxis": {
"title": {
"text": [
"Multi Score"
],
"useHTML": false,
"style": {
"color": "#666666"
}
},
"categories": null,
"plotLines": null,
"plotBands": null,
"lineWidth": null,
"tickInterval": null,
"tickLength": 10,
"floor": null,
"ceiling": null,
"gridLineInterpolation": null,
"gridLineWidth": 1,
"gridLineColor": "#e6e6e6",
"min": 0,
"max": null,
"minorTickInterval": null,
"minorTickWidth": 0,
"minTickInterval": null,
"startOnTick": true,
"endOnTick": true,
"minRange": null,
"type": "linear",
"tickmarkPlacement": null,
"labels": {
"enabled": true,
"formatter": null,
"style": {
"color": "#666666",
"cursor": "default",
"fontSize": "11px"
},
"useHTML": false
}
},
"zAxis": {
"title": {
"text": "Multi Score"
}
},
"plotOptions": {
"series": {
"dataLabels": {
"enabled": false,
"format": null,
"distance": 30,
"align": "center",
"inside": null,
"allowOverlap": false,
"style": {
"fontSize": "11px"
}
},
"showInLegend": null,
"turboThreshold": 0,
"stacking": "",
"groupPadding": 0.2,
"centerInCategory": false,
"findNearestPointBy": "x"
}
},
"navigator": {
"enabled": false
},
"scrollbar": {
"enabled": false
},
"rangeSelector": {
"enabled": false,
"inputEnabled": false
},
"legend": {
"enabled": null,
"maxHeight": null,
"align": "center",
"verticalAlign": "bottom",
"layout": "horizontal",
"width": null,
"margin": 12,
"reversed": false
},
"series": [
{
"name": "m6id.32xlarge by Amazon Web Services",
"color": "#f7981d",
"data": [
{
"x": 1259.8773779751646,
"y": 52068.52393034664
},
{
"x": 1255.2145469350944,
"y": 52255.81321330069
},
{
"x": 1263.40229014866,
"y": 52031.752008463576
},
{
"x": 1262.8466820318356,
"y": 52588.58348050779
},
{
"x": 1250.588801405571,
"y": 52965.84584743313
},
{
"x": 1257.3123438805073,
"y": 52315.18997763315
},
{
"x": 1259.1758062440229,
"y": 52798.99663776696
},
{
"x": 1261.9171659494332,
"y": 50460.3452217803
},
{
"x": 1252.4425251977896,
"y": 52385.93951359122
},
{
"x": 1258.5133250108643,
"y": 51924.08786498441
},
{
"x": 1258.6351387155526,
"y": 51213.04169550282
},
{
"x": 1250.7434437314469,
"y": 51088.391631930856
},
{
"x": 1251.0289415143955,
"y": 51400.52713651316
},
{
"x": 1259.3507043310274,
"y": 52641.39372651893
},
{
"x": 1247.371928179924,
"y": 51448.810315908224
},
{
"x": 1249.7712660347543,
"y": 51755.01947561141
},
{
"x": 1251.5672519113398,
"y": 51296.86403901086
},
{
"x": 1258.5496279212657,
"y": 52960.03782329525
},
{
"x": 1258.4584837779194,
"y": 52714.76455527141
},
{
"x": 1242.9431222626326,
"y": 50553.352864963344
},
{
"x": 1249.615391203638,
"y": 51854.70214602661
},
{
"x": 1258.690314825053,
"y": 52946.25886075842
},
{
"x": 1249.248307286008,
"y": 52812.70604252712
},
{
"x": 1249.7067254574872,
"y": 51049.992594139716
},
{
"x": 1250.2812507821272,
"y": 52155.93042126228
},
{
"x": 1260.2224176395075,
"y": 52648.75023863307
},
{
"x": 1256.4737102897125,
"y": 53320.963609647835
},
{
"x": 1251.4737191038178,
"y": 52398.80984668693
},
{
"x": 1258.7478410005376,
"y": 50806.984304852216
},
{
"x": 1258.3554812275338,
"y": 52165.917873954575
},
{
"x": 1244.9628628691075,
"y": 52584.9799000683
},
{
"x": 1250.4703702437223,
"y": 51828.43348391043
},
{
"x": 1259.2749940787028,
"y": 53078.13678817797
},
{
"x": 1258.407583682146,
"y": 53287.40404926397
},
{
"x": 1255.6082974884814,
"y": 52616.69260566442
},
{
"x": 1251.1016831620598,
"y": 51860.742092316446
},
{
"x": 1258.6161785587526,
"y": 51574.31346536421
},
{
"x": 1257.718210107013,
"y": 52616.85267295044
},
{
"x": 1250.6664131828147,
"y": 52181.84609269192
},
{
"x": 1250.3003489449488,
"y": 51738.38258051427
}
]
}
],
"drilldown": {},
"tooltip": {
"enabled": true,
"useHTML": false,
"format": null,
"headerFormat": "",
"pointFormat": "<span style=\"color:{series.color}\">Single</span>: <b>{point.x:.0f}</b><br><span style=\"color:{series.color}\">Multi</span>: <b>{point.y:.0f}</b>",
"footerFormat": "",
"shared": false,
"outside": false,
"valueDecimals": null,
"split": false
},
"annotations": null
},
"hc_type": "chart",
"id": "127674000045871038507706848526712721167"
}
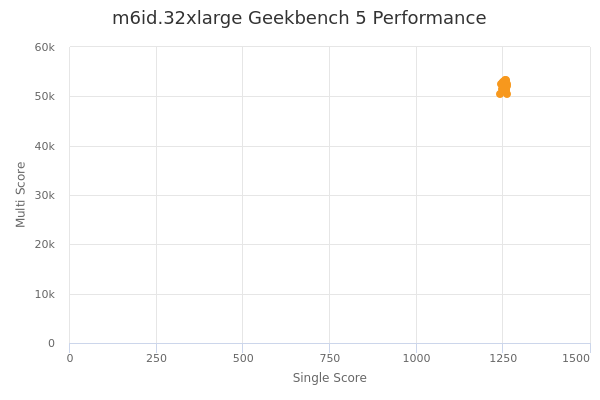
| Single | Multi | |
|---|---|---|
| Max | 1263 | 53321 |
| Average | 1255 | 52110 |
| Deviation | 5.04 | 729.19 |
| Min | 1243 | 50460 |
Sign up as Freemium to get more insight.