m6id.8xlarge by Amazon Web Services
Geekbench is a cross-platform processor benchmark with a scoring system that determines single-core and multi-core performance using loads simulating real-world scenarios. Geekbench 5 score is calculated with a reference score of 2500 representing the performance of the Intel Core i5-2520M @ 2.50 GHz. The software benchmark is available for Mac OS, Windows, Linux, Android and iOS platforms.
Specifications:
CPU
32
RAM
128.0 GB
Extra
1x
1900 GB
SSD
Net
12000 Mbps
{
"configuration": {
"chart": {
"type": "scatter",
"polar": false,
"zoomType": "",
"options3d": {},
"height": null,
"width": null,
"margin": null,
"inverted": false,
"zooming": {}
},
"credits": {
"enabled": false
},
"title": {
"text": ""
},
"colorAxis": null,
"subtitle": {
"text": ""
},
"xAxis": {
"title": {
"text": [
"Single Score"
],
"useHTML": false,
"style": {
"color": "#666666"
}
},
"categories": null,
"lineWidth": 1,
"tickInterval": null,
"tickWidth": 1,
"tickLength": 10,
"tickPixelInterval": 100,
"plotLines": null,
"labels": {
"enabled": true,
"format": null,
"formatter": "",
"style": {
"color": "#666666",
"cursor": "default",
"fontSize": "11px"
},
"useHTML": false,
"step": 0
},
"plotBands": null,
"visible": true,
"floor": null,
"ceiling": null,
"type": "linear",
"min": 0,
"gridLineWidth": 1,
"gridLineColor": "#e6e6e6",
"minorTickInterval": null,
"minorTickWidth": 0,
"minTickInterval": null,
"startOnTick": true,
"endOnTick": true,
"tickmarkPlacement": 100,
"units": 100,
"minRange": 100
},
"yAxis": {
"title": {
"text": [
"Multi Score"
],
"useHTML": false,
"style": {
"color": "#666666"
}
},
"categories": null,
"plotLines": null,
"plotBands": null,
"lineWidth": null,
"tickInterval": null,
"tickLength": 10,
"floor": null,
"ceiling": null,
"gridLineInterpolation": null,
"gridLineWidth": 1,
"gridLineColor": "#e6e6e6",
"min": 0,
"max": null,
"minorTickInterval": null,
"minorTickWidth": 0,
"minTickInterval": null,
"startOnTick": true,
"endOnTick": true,
"minRange": null,
"type": "linear",
"tickmarkPlacement": null,
"labels": {
"enabled": true,
"formatter": null,
"style": {
"color": "#666666",
"cursor": "default",
"fontSize": "11px"
},
"useHTML": false
}
},
"zAxis": {
"title": {
"text": "Multi Score"
}
},
"plotOptions": {
"series": {
"dataLabels": {
"enabled": false,
"format": null,
"distance": 30,
"align": "center",
"inside": null,
"allowOverlap": false,
"style": {
"fontSize": "11px"
}
},
"showInLegend": null,
"turboThreshold": 0,
"stacking": "",
"groupPadding": 0.2,
"centerInCategory": false,
"findNearestPointBy": "x"
}
},
"navigator": {
"enabled": false
},
"scrollbar": {
"enabled": false
},
"rangeSelector": {
"enabled": false,
"inputEnabled": false
},
"legend": {
"enabled": null,
"maxHeight": null,
"align": "center",
"verticalAlign": "bottom",
"layout": "horizontal",
"width": null,
"margin": 12,
"reversed": false
},
"series": [
{
"name": "m6id.8xlarge by Amazon Web Services",
"color": "#f7981d",
"data": [
{
"x": 1247.2482304082127,
"y": 18380.872084211114
},
{
"x": 1250.72963011719,
"y": 18384.378692844104
},
{
"x": 1255.4205703313335,
"y": 18340.114788014154
},
{
"x": 1253.5192454805638,
"y": 18387.947420654884
},
{
"x": 1260.667845285566,
"y": 18398.398269225854
},
{
"x": 1252.4282580338509,
"y": 18380.732666844102
},
{
"x": 1255.9760964320496,
"y": 18405.54716650411
},
{
"x": 1250.1942418620386,
"y": 18443.012022511015
},
{
"x": 1256.1010507373326,
"y": 18431.977024981963
},
{
"x": 1251.114164713058,
"y": 18166.254437001902
},
{
"x": 1250.9689264969982,
"y": 18357.052657605116
},
{
"x": 1240.9639316611683,
"y": 18404.870745870307
},
{
"x": 1262.1149967816532,
"y": 18373.64116295262
},
{
"x": 1249.2352181456945,
"y": 18317.02156548669
},
{
"x": 1262.6806491390073,
"y": 18325.193805571715
},
{
"x": 1241.9558013341089,
"y": 18422.921544806948
},
{
"x": 1255.699617927101,
"y": 18369.5915624588
},
{
"x": 1248.0835551047883,
"y": 18502.395395903302
},
{
"x": 1216.0595578617929,
"y": 18427.71178543494
},
{
"x": 1250.3842255274733,
"y": 18430.719476341117
}
]
}
],
"drilldown": {},
"tooltip": {
"enabled": true,
"useHTML": false,
"format": null,
"headerFormat": "",
"pointFormat": "<span style=\"color:{series.color}\">Single</span>: <b>{point.x:.0f}</b><br><span style=\"color:{series.color}\">Multi</span>: <b>{point.y:.0f}</b>",
"footerFormat": "",
"shared": false,
"outside": false,
"valueDecimals": null,
"split": false
},
"annotations": null
},
"hc_type": "chart",
"id": "154006325536411371579088259321908104028"
}
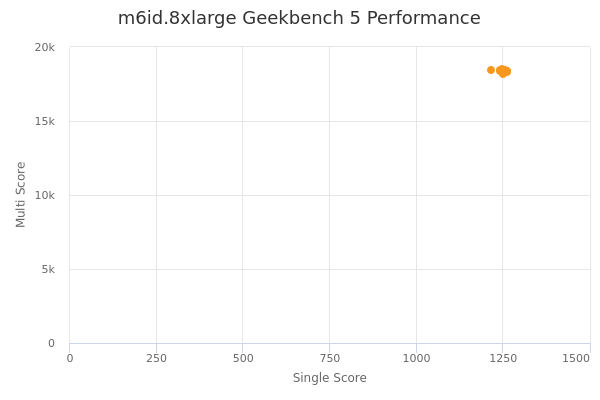
| Single | Multi | |
|---|---|---|
| Max | 1263 | 18502 |
| Average | 1251 | 18383 |
| Deviation | 9.70 | 65.13 |
| Min | 1216 | 18166 |
Sign up as Freemium to get more insight.