r6a.8xlarge by Amazon Web Services
Geekbench is a cross-platform processor benchmark with a scoring system that determines single-core and multi-core performance using loads simulating real-world scenarios. Geekbench 5 score is calculated with a reference score of 2500 representing the performance of the Intel Core i5-2520M @ 2.50 GHz. The software benchmark is available for Mac OS, Windows, Linux, Android and iOS platforms.
Specifications:
CPU
32
RAM
256.0 GB
Net
12000 Mbps
{
"configuration": {
"chart": {
"type": "scatter",
"polar": false,
"zoomType": "",
"options3d": {},
"height": null,
"width": null,
"margin": null,
"inverted": false,
"zooming": {}
},
"credits": {
"enabled": false
},
"title": {
"text": ""
},
"colorAxis": null,
"subtitle": {
"text": ""
},
"xAxis": {
"title": {
"text": [
"Single Score"
],
"useHTML": false,
"style": {
"color": "#666666"
}
},
"categories": null,
"lineWidth": 1,
"tickInterval": null,
"tickWidth": 1,
"tickLength": 10,
"tickPixelInterval": 100,
"plotLines": null,
"labels": {
"enabled": true,
"format": null,
"formatter": "",
"style": {
"color": "#666666",
"cursor": "default",
"fontSize": "11px"
},
"useHTML": false,
"step": 0
},
"plotBands": null,
"visible": true,
"floor": null,
"ceiling": null,
"type": "linear",
"min": 0,
"gridLineWidth": 1,
"gridLineColor": "#e6e6e6",
"minorTickInterval": null,
"minorTickWidth": 0,
"minTickInterval": null,
"startOnTick": true,
"endOnTick": true,
"tickmarkPlacement": 100,
"units": 100,
"minRange": 100
},
"yAxis": {
"title": {
"text": [
"Multi Score"
],
"useHTML": false,
"style": {
"color": "#666666"
}
},
"categories": null,
"plotLines": null,
"plotBands": null,
"lineWidth": null,
"tickInterval": null,
"tickLength": 10,
"floor": null,
"ceiling": null,
"gridLineInterpolation": null,
"gridLineWidth": 1,
"gridLineColor": "#e6e6e6",
"min": 0,
"max": null,
"minorTickInterval": null,
"minorTickWidth": 0,
"minTickInterval": null,
"startOnTick": true,
"endOnTick": true,
"minRange": null,
"type": "linear",
"tickmarkPlacement": null,
"labels": {
"enabled": true,
"formatter": null,
"style": {
"color": "#666666",
"cursor": "default",
"fontSize": "11px"
},
"useHTML": false
}
},
"zAxis": {
"title": {
"text": "Multi Score"
}
},
"plotOptions": {
"series": {
"dataLabels": {
"enabled": false,
"format": null,
"distance": 30,
"align": "center",
"inside": null,
"allowOverlap": false,
"style": {
"fontSize": "11px"
}
},
"showInLegend": null,
"turboThreshold": 0,
"stacking": "",
"groupPadding": 0.2,
"centerInCategory": false,
"findNearestPointBy": "x"
}
},
"navigator": {
"enabled": false
},
"scrollbar": {
"enabled": false
},
"rangeSelector": {
"enabled": false,
"inputEnabled": false
},
"legend": {
"enabled": null,
"maxHeight": null,
"align": "center",
"verticalAlign": "bottom",
"layout": "horizontal",
"width": null,
"margin": 12,
"reversed": false
},
"series": [
{
"name": "r6a.8xlarge by Amazon Web Services",
"color": "#f7981d",
"data": [
{
"x": 1324.7694806265386,
"y": 18317.140919994374
},
{
"x": 1322.7922621172106,
"y": 18179.67644422438
},
{
"x": 1314.3816839140643,
"y": 18270.45084365381
},
{
"x": 1317.156363421139,
"y": 17846.385449284222
},
{
"x": 1315.9527151911188,
"y": 18348.12084347149
},
{
"x": 1323.4020174672962,
"y": 18020.978979332685
},
{
"x": 1317.098556568498,
"y": 18484.870386833565
},
{
"x": 1318.3741192332595,
"y": 18268.355033626452
},
{
"x": 1315.697313356959,
"y": 18215.76874732504
},
{
"x": 1317.8144202162944,
"y": 18214.06212396005
},
{
"x": 1316.5248716123833,
"y": 18116.732884899902
},
{
"x": 1318.5901716678854,
"y": 18109.318930746456
},
{
"x": 1319.5751512874301,
"y": 18498.981554003978
},
{
"x": 1321.4616352341175,
"y": 18178.848848210535
},
{
"x": 1318.7784884123635,
"y": 18042.162294388723
},
{
"x": 1316.2510187500718,
"y": 18176.584364071583
},
{
"x": 1319.8530618563905,
"y": 17955.33605531318
},
{
"x": 1323.8194102130553,
"y": 17265.310945821446
},
{
"x": 1317.1765240394834,
"y": 18341.181110656
},
{
"x": 1319.1230980105092,
"y": 17776.843440703353
}
]
}
],
"drilldown": {},
"tooltip": {
"enabled": true,
"useHTML": false,
"format": null,
"headerFormat": "",
"pointFormat": "<span style=\"color:{series.color}\">Single</span>: <b>{point.x:.0f}</b><br><span style=\"color:{series.color}\">Multi</span>: <b>{point.y:.0f}</b>",
"footerFormat": "",
"shared": false,
"outside": false,
"valueDecimals": null,
"split": false
},
"annotations": null
},
"hc_type": "chart",
"id": "118980436130422656509011513481997405368"
}
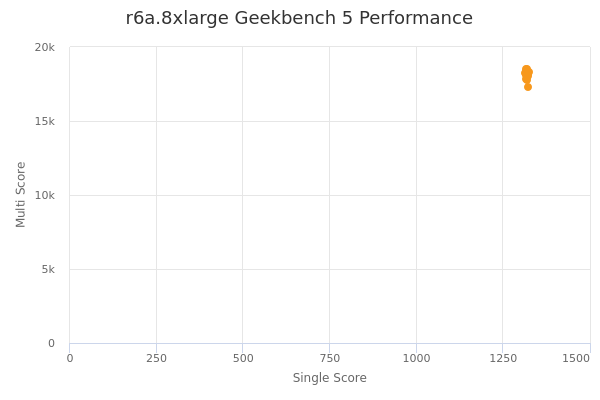
| Single | Multi | |
|---|---|---|
| Max | 1325 | 18499 |
| Average | 1319 | 18131 |
| Deviation | 2.87 | 269.55 |
| Min | 1314 | 17265 |
Sign up as Freemium to get more insight.