r6a.metal by Amazon Web Services
Geekbench is a cross-platform processor benchmark with a scoring system that determines single-core and multi-core performance using loads simulating real-world scenarios. Geekbench 5 score is calculated with a reference score of 2500 representing the performance of the Intel Core i5-2520M @ 2.50 GHz. The software benchmark is available for Mac OS, Windows, Linux, Android and iOS platforms.
Specifications:
CPU
192
RAM
1536.0 GB
Net
50000 Mbps
{
"configuration": {
"chart": {
"type": "scatter",
"polar": false,
"zoomType": "",
"options3d": {},
"height": null,
"width": null,
"margin": null,
"inverted": false,
"zooming": {}
},
"credits": {
"enabled": false
},
"title": {
"text": ""
},
"colorAxis": null,
"subtitle": {
"text": ""
},
"xAxis": {
"title": {
"text": [
"Single Score"
],
"useHTML": false,
"style": {
"color": "#666666"
}
},
"categories": null,
"lineWidth": 1,
"tickInterval": null,
"tickWidth": 1,
"tickLength": 10,
"tickPixelInterval": 100,
"plotLines": null,
"labels": {
"enabled": true,
"format": null,
"formatter": "",
"style": {
"color": "#666666",
"cursor": "default",
"fontSize": "11px"
},
"useHTML": false,
"step": 0
},
"plotBands": null,
"visible": true,
"floor": null,
"ceiling": null,
"type": "linear",
"min": 0,
"gridLineWidth": 1,
"gridLineColor": "#e6e6e6",
"minorTickInterval": null,
"minorTickWidth": 0,
"minTickInterval": null,
"startOnTick": true,
"endOnTick": true,
"tickmarkPlacement": 100,
"units": 100,
"minRange": 100
},
"yAxis": {
"title": {
"text": [
"Multi Score"
],
"useHTML": false,
"style": {
"color": "#666666"
}
},
"categories": null,
"plotLines": null,
"plotBands": null,
"lineWidth": null,
"tickInterval": null,
"tickLength": 10,
"floor": null,
"ceiling": null,
"gridLineInterpolation": null,
"gridLineWidth": 1,
"gridLineColor": "#e6e6e6",
"min": 0,
"max": null,
"minorTickInterval": null,
"minorTickWidth": 0,
"minTickInterval": null,
"startOnTick": true,
"endOnTick": true,
"minRange": null,
"type": "linear",
"tickmarkPlacement": null,
"labels": {
"enabled": true,
"formatter": null,
"style": {
"color": "#666666",
"cursor": "default",
"fontSize": "11px"
},
"useHTML": false
}
},
"zAxis": {
"title": {
"text": "Multi Score"
}
},
"plotOptions": {
"series": {
"dataLabels": {
"enabled": false,
"format": null,
"distance": 30,
"align": "center",
"inside": null,
"allowOverlap": false,
"style": {
"fontSize": "11px"
}
},
"showInLegend": null,
"turboThreshold": 0,
"stacking": "",
"groupPadding": 0.2,
"centerInCategory": false,
"findNearestPointBy": "x"
}
},
"navigator": {
"enabled": false
},
"scrollbar": {
"enabled": false
},
"rangeSelector": {
"enabled": false,
"inputEnabled": false
},
"legend": {
"enabled": null,
"maxHeight": null,
"align": "center",
"verticalAlign": "bottom",
"layout": "horizontal",
"width": null,
"margin": 12,
"reversed": false
},
"series": [
{
"name": "r6a.metal by Amazon Web Services",
"color": "#f7981d",
"data": [
{
"x": 1369.6057864949962,
"y": 62345.25871364354
},
{
"x": 1361.780236802389,
"y": 61038.26042774899
},
{
"x": 1369.672785740233,
"y": 60970.387927388
},
{
"x": 1366.1078822869745,
"y": 61708.54045204639
},
{
"x": 1365.3312602021617,
"y": 61035.85688453251
},
{
"x": 1369.8191771172665,
"y": 60654.97489259744
},
{
"x": 1365.2234437150044,
"y": 62136.56707417325
},
{
"x": 1372.2905896379273,
"y": 61210.62326029982
},
{
"x": 1369.4150477436679,
"y": 60677.00501699826
},
{
"x": 1371.3487547138443,
"y": 58756.958852026335
},
{
"x": 1373.130829157189,
"y": 60473.149713418265
},
{
"x": 1366.4140479496928,
"y": 61297.11244762506
},
{
"x": 1369.8829215453227,
"y": 63430.745303004674
},
{
"x": 1369.1165316473578,
"y": 60715.18148286149
},
{
"x": 1368.1798343845185,
"y": 63247.29696216901
},
{
"x": 1362.2864548261166,
"y": 59890.15855691142
},
{
"x": 1372.9021389907566,
"y": 61122.141012516564
},
{
"x": 1366.474712412821,
"y": 63359.11812915844
},
{
"x": 1366.9562079310474,
"y": 57983.29354728418
},
{
"x": 1367.004935963942,
"y": 60228.5283828541
}
]
}
],
"drilldown": {},
"tooltip": {
"enabled": true,
"useHTML": false,
"format": null,
"headerFormat": "",
"pointFormat": "<span style=\"color:{series.color}\">Single</span>: <b>{point.x:.0f}</b><br><span style=\"color:{series.color}\">Multi</span>: <b>{point.y:.0f}</b>",
"footerFormat": "",
"shared": false,
"outside": false,
"valueDecimals": null,
"split": false
},
"annotations": null
},
"hc_type": "chart",
"id": "271384408984880709437538322024933776903"
}
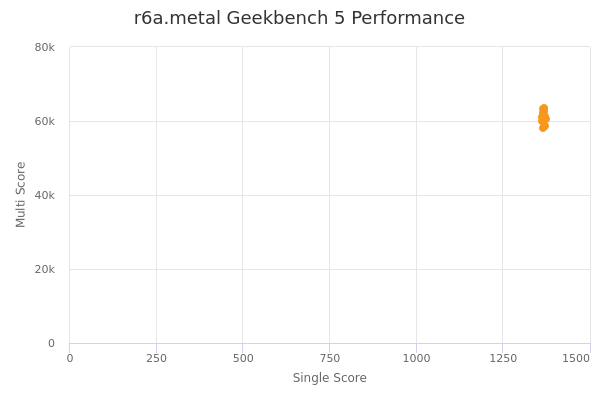
| Single | Multi | |
|---|---|---|
| Max | 1373 | 63431 |
| Average | 1368 | 61114 |
| Deviation | 3.10 | 1352.03 |
| Min | 1362 | 57983 |
Sign up as Freemium to get more insight.