r6a.32xlarge by Amazon Web Services
Geekbench is a cross-platform processor benchmark with a scoring system that determines single-core and multi-core performance using loads simulating real-world scenarios. Geekbench 5 score is calculated with a reference score of 2500 representing the performance of the Intel Core i5-2520M @ 2.50 GHz. The software benchmark is available for Mac OS, Windows, Linux, Android and iOS platforms.
Specifications:
CPU
128
RAM
1024.0 GB
Net
50000 Mbps
{
"configuration": {
"chart": {
"type": "scatter",
"polar": false,
"zoomType": "",
"options3d": {},
"height": null,
"width": null,
"margin": null,
"inverted": false,
"zooming": {}
},
"credits": {
"enabled": false
},
"title": {
"text": ""
},
"colorAxis": null,
"subtitle": {
"text": ""
},
"xAxis": {
"title": {
"text": [
"Single Score"
],
"useHTML": false,
"style": {
"color": "#666666"
}
},
"categories": null,
"lineWidth": 1,
"tickInterval": null,
"tickWidth": 1,
"tickLength": 10,
"tickPixelInterval": 100,
"plotLines": null,
"labels": {
"enabled": true,
"format": null,
"formatter": "",
"style": {
"color": "#666666",
"cursor": "default",
"fontSize": "11px"
},
"useHTML": false,
"step": 0
},
"plotBands": null,
"visible": true,
"floor": null,
"ceiling": null,
"type": "linear",
"min": 0,
"gridLineWidth": 1,
"gridLineColor": "#e6e6e6",
"minorTickInterval": null,
"minorTickWidth": 0,
"minTickInterval": null,
"startOnTick": true,
"endOnTick": true,
"tickmarkPlacement": 100,
"units": 100,
"minRange": 100
},
"yAxis": {
"title": {
"text": [
"Multi Score"
],
"useHTML": false,
"style": {
"color": "#666666"
}
},
"categories": null,
"plotLines": null,
"plotBands": null,
"lineWidth": null,
"tickInterval": null,
"tickLength": 10,
"floor": null,
"ceiling": null,
"gridLineInterpolation": null,
"gridLineWidth": 1,
"gridLineColor": "#e6e6e6",
"min": 0,
"max": null,
"minorTickInterval": null,
"minorTickWidth": 0,
"minTickInterval": null,
"startOnTick": true,
"endOnTick": true,
"minRange": null,
"type": "linear",
"tickmarkPlacement": null,
"labels": {
"enabled": true,
"formatter": null,
"style": {
"color": "#666666",
"cursor": "default",
"fontSize": "11px"
},
"useHTML": false
}
},
"zAxis": {
"title": {
"text": "Multi Score"
}
},
"plotOptions": {
"series": {
"dataLabels": {
"enabled": false,
"format": null,
"distance": 30,
"align": "center",
"inside": null,
"allowOverlap": false,
"style": {
"fontSize": "11px"
}
},
"showInLegend": null,
"turboThreshold": 0,
"stacking": "",
"groupPadding": 0.2,
"centerInCategory": false,
"findNearestPointBy": "x"
}
},
"navigator": {
"enabled": false
},
"scrollbar": {
"enabled": false
},
"rangeSelector": {
"enabled": false,
"inputEnabled": false
},
"legend": {
"enabled": null,
"maxHeight": null,
"align": "center",
"verticalAlign": "bottom",
"layout": "horizontal",
"width": null,
"margin": 12,
"reversed": false
},
"series": [
{
"name": "r6a.32xlarge by Amazon Web Services",
"color": "#f7981d",
"data": [
{
"x": 1309.2703061041298,
"y": 49198.34270485884
},
{
"x": 1307.1896145849194,
"y": 46594.777551391024
},
{
"x": 1301.5240750291773,
"y": 48218.271101543054
},
{
"x": 1294.1226139578187,
"y": 49866.871430239735
},
{
"x": 1304.5621431774646,
"y": 48533.93092225825
},
{
"x": 1297.3530591648312,
"y": 46718.86858116308
},
{
"x": 1296.973369575239,
"y": 49472.8065615964
},
{
"x": 1296.4598335967407,
"y": 49022.158856569025
},
{
"x": 1297.6660689942555,
"y": 48058.23983143116
},
{
"x": 1298.5198896402032,
"y": 48497.24601772788
},
{
"x": 1300.5791362402629,
"y": 47742.152745595144
},
{
"x": 1293.7509318275852,
"y": 48406.4423673846
},
{
"x": 1298.3606534970781,
"y": 49904.886100393574
},
{
"x": 1299.9029558978064,
"y": 47594.521297856045
},
{
"x": 1299.0758123564779,
"y": 48585.27508829709
},
{
"x": 1300.6367911973875,
"y": 48654.082676826816
},
{
"x": 1296.0274989074858,
"y": 49031.88924153545
},
{
"x": 1302.8168399329722,
"y": 48940.089990561915
},
{
"x": 1300.7077280442288,
"y": 48660.76448594175
},
{
"x": 1294.5460879137534,
"y": 49539.88409337293
}
]
}
],
"drilldown": {},
"tooltip": {
"enabled": true,
"useHTML": false,
"format": null,
"headerFormat": "",
"pointFormat": "<span style=\"color:{series.color}\">Single</span>: <b>{point.x:.0f}</b><br><span style=\"color:{series.color}\">Multi</span>: <b>{point.y:.0f}</b>",
"footerFormat": "",
"shared": false,
"outside": false,
"valueDecimals": null,
"split": false
},
"annotations": null
},
"hc_type": "chart",
"id": "176848954228937890175193976061600448861"
}
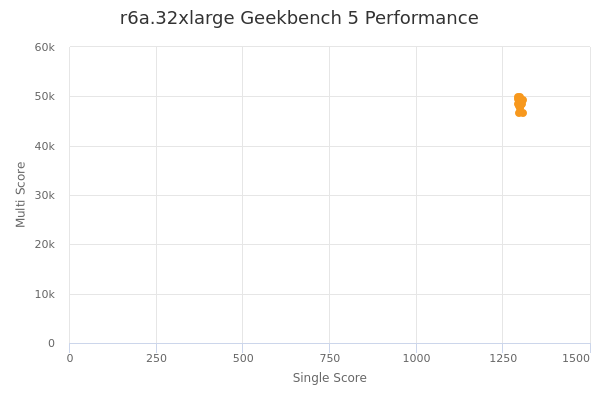
| Single | Multi | |
|---|---|---|
| Max | 1309 | 49905 |
| Average | 1300 | 48562 |
| Deviation | 4.02 | 882.25 |
| Min | 1294 | 46595 |
Sign up as Freemium to get more insight.