r6a.24xlarge by Amazon Web Services
Geekbench is a cross-platform processor benchmark with a scoring system that determines single-core and multi-core performance using loads simulating real-world scenarios. Geekbench 5 score is calculated with a reference score of 2500 representing the performance of the Intel Core i5-2520M @ 2.50 GHz. The software benchmark is available for Mac OS, Windows, Linux, Android and iOS platforms.
Specifications:
CPU
96
RAM
768.0 GB
Net
37000 Mbps
{
"configuration": {
"chart": {
"type": "scatter",
"polar": false,
"zoomType": "",
"options3d": {},
"height": null,
"width": null,
"margin": null,
"inverted": false,
"zooming": {}
},
"credits": {
"enabled": false
},
"title": {
"text": ""
},
"colorAxis": null,
"subtitle": {
"text": ""
},
"xAxis": {
"title": {
"text": [
"Single Score"
],
"useHTML": false,
"style": {
"color": "#666666"
}
},
"categories": null,
"lineWidth": 1,
"tickInterval": null,
"tickWidth": 1,
"tickLength": 10,
"tickPixelInterval": 100,
"plotLines": null,
"labels": {
"enabled": true,
"format": null,
"formatter": "",
"style": {
"color": "#666666",
"cursor": "default",
"fontSize": "11px"
},
"useHTML": false,
"step": 0
},
"plotBands": null,
"visible": true,
"floor": null,
"ceiling": null,
"type": "linear",
"min": 0,
"gridLineWidth": 1,
"gridLineColor": "#e6e6e6",
"minorTickInterval": null,
"minorTickWidth": 0,
"minTickInterval": null,
"startOnTick": true,
"endOnTick": true,
"tickmarkPlacement": 100,
"units": 100,
"minRange": 100
},
"yAxis": {
"title": {
"text": [
"Multi Score"
],
"useHTML": false,
"style": {
"color": "#666666"
}
},
"categories": null,
"plotLines": null,
"plotBands": null,
"lineWidth": null,
"tickInterval": null,
"tickLength": 10,
"floor": null,
"ceiling": null,
"gridLineInterpolation": null,
"gridLineWidth": 1,
"gridLineColor": "#e6e6e6",
"min": 0,
"max": null,
"minorTickInterval": null,
"minorTickWidth": 0,
"minTickInterval": null,
"startOnTick": true,
"endOnTick": true,
"minRange": null,
"type": "linear",
"tickmarkPlacement": null,
"labels": {
"enabled": true,
"formatter": null,
"style": {
"color": "#666666",
"cursor": "default",
"fontSize": "11px"
},
"useHTML": false
}
},
"zAxis": {
"title": {
"text": "Multi Score"
}
},
"plotOptions": {
"series": {
"dataLabels": {
"enabled": false,
"format": null,
"distance": 30,
"align": "center",
"inside": null,
"allowOverlap": false,
"style": {
"fontSize": "11px"
}
},
"showInLegend": null,
"turboThreshold": 0,
"stacking": "",
"groupPadding": 0.2,
"centerInCategory": false,
"findNearestPointBy": "x"
}
},
"navigator": {
"enabled": false
},
"scrollbar": {
"enabled": false
},
"rangeSelector": {
"enabled": false,
"inputEnabled": false
},
"legend": {
"enabled": null,
"maxHeight": null,
"align": "center",
"verticalAlign": "bottom",
"layout": "horizontal",
"width": null,
"margin": 12,
"reversed": false
},
"series": [
{
"name": "r6a.24xlarge by Amazon Web Services",
"color": "#f7981d",
"data": [
{
"x": 1307.3292604283286,
"y": 37840.706209415555
},
{
"x": 1309.9367088329313,
"y": 37734.23258040744
},
{
"x": 1303.1539198823152,
"y": 37078.18675372386
},
{
"x": 1298.6463979109278,
"y": 36337.63988270893
},
{
"x": 1299.1679878797536,
"y": 36645.97424024445
},
{
"x": 1300.6765413965227,
"y": 36678.15038873207
},
{
"x": 1305.8139090811187,
"y": 39192.898791600106
},
{
"x": 1297.6409060476299,
"y": 38502.2425665961
},
{
"x": 1302.1705607490235,
"y": 37957.86601461858
},
{
"x": 1298.9811091403237,
"y": 38157.75358609614
},
{
"x": 1298.548439106504,
"y": 38208.34030612261
},
{
"x": 1301.2158153943894,
"y": 38925.4280259424
},
{
"x": 1298.5941538690015,
"y": 38427.89391672301
},
{
"x": 1300.170257914954,
"y": 35506.8317018293
},
{
"x": 1299.0745096773232,
"y": 38212.54057678263
},
{
"x": 1303.6604156893081,
"y": 37457.99144454066
},
{
"x": 1305.46750132345,
"y": 36345.51518909176
},
{
"x": 1302.3175894258306,
"y": 37714.082122438565
},
{
"x": 1300.7584288584108,
"y": 37376.339865488335
},
{
"x": 1295.2073233943981,
"y": 36561.3587543791
}
]
}
],
"drilldown": {},
"tooltip": {
"enabled": true,
"useHTML": false,
"format": null,
"headerFormat": "",
"pointFormat": "<span style=\"color:{series.color}\">Single</span>: <b>{point.x:.0f}</b><br><span style=\"color:{series.color}\">Multi</span>: <b>{point.y:.0f}</b>",
"footerFormat": "",
"shared": false,
"outside": false,
"valueDecimals": null,
"split": false
},
"annotations": null
},
"hc_type": "chart",
"id": "36975220118677365308837656315291045847"
}
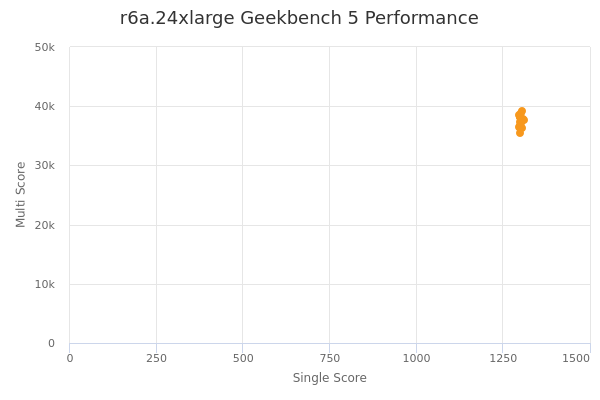
| Single | Multi | |
|---|---|---|
| Max | 1310 | 39193 |
| Average | 1301 | 37543 |
| Deviation | 3.52 | 941.60 |
| Min | 1295 | 35507 |
Sign up as Freemium to get more insight.