r6a.48xlarge by Amazon Web Services
Geekbench is a cross-platform processor benchmark with a scoring system that determines single-core and multi-core performance using loads simulating real-world scenarios. Geekbench 5 score is calculated with a reference score of 2500 representing the performance of the Intel Core i5-2520M @ 2.50 GHz. The software benchmark is available for Mac OS, Windows, Linux, Android and iOS platforms.
Specifications:
CPU
192
RAM
1536.0 GB
Net
50000 Mbps
{
"configuration": {
"chart": {
"type": "scatter",
"polar": false,
"zoomType": "",
"options3d": {},
"height": null,
"width": null,
"margin": null,
"inverted": false,
"zooming": {}
},
"credits": {
"enabled": false
},
"title": {
"text": ""
},
"colorAxis": null,
"subtitle": {
"text": ""
},
"xAxis": {
"title": {
"text": [
"Single Score"
],
"useHTML": false,
"style": {
"color": "#666666"
}
},
"categories": null,
"lineWidth": 1,
"tickInterval": null,
"tickWidth": 1,
"tickLength": 10,
"tickPixelInterval": 100,
"plotLines": null,
"labels": {
"enabled": true,
"format": null,
"formatter": "",
"style": {
"color": "#666666",
"cursor": "default",
"fontSize": "11px"
},
"useHTML": false,
"step": 0
},
"plotBands": null,
"visible": true,
"floor": null,
"ceiling": null,
"type": "linear",
"min": 0,
"gridLineWidth": 1,
"gridLineColor": "#e6e6e6",
"minorTickInterval": null,
"minorTickWidth": 0,
"minTickInterval": null,
"startOnTick": true,
"endOnTick": true,
"tickmarkPlacement": 100,
"units": 100,
"minRange": 100
},
"yAxis": {
"title": {
"text": [
"Multi Score"
],
"useHTML": false,
"style": {
"color": "#666666"
}
},
"categories": null,
"plotLines": null,
"plotBands": null,
"lineWidth": null,
"tickInterval": null,
"tickLength": 10,
"floor": null,
"ceiling": null,
"gridLineInterpolation": null,
"gridLineWidth": 1,
"gridLineColor": "#e6e6e6",
"min": 0,
"max": null,
"minorTickInterval": null,
"minorTickWidth": 0,
"minTickInterval": null,
"startOnTick": true,
"endOnTick": true,
"minRange": null,
"type": "linear",
"tickmarkPlacement": null,
"labels": {
"enabled": true,
"formatter": null,
"style": {
"color": "#666666",
"cursor": "default",
"fontSize": "11px"
},
"useHTML": false
}
},
"zAxis": {
"title": {
"text": "Multi Score"
}
},
"plotOptions": {
"series": {
"dataLabels": {
"enabled": false,
"format": null,
"distance": 30,
"align": "center",
"inside": null,
"allowOverlap": false,
"style": {
"fontSize": "11px"
}
},
"showInLegend": null,
"turboThreshold": 0,
"stacking": "",
"groupPadding": 0.2,
"centerInCategory": false,
"findNearestPointBy": "x"
}
},
"navigator": {
"enabled": false
},
"scrollbar": {
"enabled": false
},
"rangeSelector": {
"enabled": false,
"inputEnabled": false
},
"legend": {
"enabled": null,
"maxHeight": null,
"align": "center",
"verticalAlign": "bottom",
"layout": "horizontal",
"width": null,
"margin": 12,
"reversed": false
},
"series": [
{
"name": "r6a.48xlarge by Amazon Web Services",
"color": "#f7981d",
"data": [
{
"x": 1309.844908824794,
"y": 60069.08100269412
},
{
"x": 1308.4243830672424,
"y": 59212.59930696952
},
{
"x": 1300.0342934734622,
"y": 61118.18072619439
},
{
"x": 1300.880125822989,
"y": 59972.05953701966
},
{
"x": 1306.4656499191913,
"y": 59787.510842417934
},
{
"x": 1304.109101384923,
"y": 59584.58898687322
},
{
"x": 1301.4532359499085,
"y": 62519.17090559662
},
{
"x": 1297.434134302489,
"y": 60335.917411225324
},
{
"x": 1298.0096330628764,
"y": 59659.57053200745
},
{
"x": 1297.2006465474867,
"y": 61352.10572768429
},
{
"x": 1305.1429377615545,
"y": 60999.08219633801
},
{
"x": 1297.9305717819984,
"y": 60522.07036694047
},
{
"x": 1307.3418196268603,
"y": 60832.224021110516
},
{
"x": 1303.7498218274582,
"y": 59011.77261564629
},
{
"x": 1300.443949172457,
"y": 60192.1138746457
},
{
"x": 1297.014924204095,
"y": 59885.31713770122
},
{
"x": 1295.58031588618,
"y": 59785.80686414904
},
{
"x": 1300.9351750407063,
"y": 60696.569849362495
},
{
"x": 1295.7969658321367,
"y": 62219.078071427844
},
{
"x": 1296.9408485351494,
"y": 61971.01475631604
}
]
}
],
"drilldown": {},
"tooltip": {
"enabled": true,
"useHTML": false,
"format": null,
"headerFormat": "",
"pointFormat": "<span style=\"color:{series.color}\">Single</span>: <b>{point.x:.0f}</b><br><span style=\"color:{series.color}\">Multi</span>: <b>{point.y:.0f}</b>",
"footerFormat": "",
"shared": false,
"outside": false,
"valueDecimals": null,
"split": false
},
"annotations": null
},
"hc_type": "chart",
"id": "42117701845161914651111481309027752053"
}
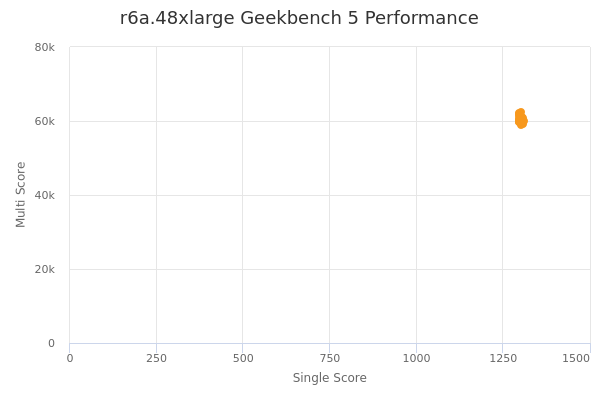
| Single | Multi | |
|---|---|---|
| Max | 1310 | 62519 |
| Average | 1301 | 60486 |
| Deviation | 4.32 | 951.25 |
| Min | 1296 | 59012 |
Sign up as Freemium to get more insight.