r6a.large by Amazon Web Services
Geekbench is a cross-platform processor benchmark with a scoring system that determines single-core and multi-core performance using loads simulating real-world scenarios. Geekbench 5 score is calculated with a reference score of 2500 representing the performance of the Intel Core i5-2520M @ 2.50 GHz. The software benchmark is available for Mac OS, Windows, Linux, Android and iOS platforms.
Specifications:
CPU
2
RAM
16.0 GB
Net
12000 Mbps
{
"configuration": {
"chart": {
"type": "scatter",
"polar": false,
"zoomType": "",
"options3d": {},
"height": null,
"width": null,
"margin": null,
"inverted": false,
"zooming": {}
},
"credits": {
"enabled": false
},
"title": {
"text": ""
},
"colorAxis": null,
"subtitle": {
"text": ""
},
"xAxis": {
"title": {
"text": [
"Single Score"
],
"useHTML": false,
"style": {
"color": "#666666"
}
},
"categories": null,
"lineWidth": 1,
"tickInterval": null,
"tickWidth": 1,
"tickLength": 10,
"tickPixelInterval": 100,
"plotLines": null,
"labels": {
"enabled": true,
"format": null,
"formatter": "",
"style": {
"color": "#666666",
"cursor": "default",
"fontSize": "11px"
},
"useHTML": false,
"step": 0
},
"plotBands": null,
"visible": true,
"floor": null,
"ceiling": null,
"type": "linear",
"min": 0,
"gridLineWidth": 1,
"gridLineColor": "#e6e6e6",
"minorTickInterval": null,
"minorTickWidth": 0,
"minTickInterval": null,
"startOnTick": true,
"endOnTick": true,
"tickmarkPlacement": 100,
"units": 100,
"minRange": 100
},
"yAxis": {
"title": {
"text": [
"Multi Score"
],
"useHTML": false,
"style": {
"color": "#666666"
}
},
"categories": null,
"plotLines": null,
"plotBands": null,
"lineWidth": null,
"tickInterval": null,
"tickLength": 10,
"floor": null,
"ceiling": null,
"gridLineInterpolation": null,
"gridLineWidth": 1,
"gridLineColor": "#e6e6e6",
"min": 0,
"max": null,
"minorTickInterval": null,
"minorTickWidth": 0,
"minTickInterval": null,
"startOnTick": true,
"endOnTick": true,
"minRange": null,
"type": "linear",
"tickmarkPlacement": null,
"labels": {
"enabled": true,
"formatter": null,
"style": {
"color": "#666666",
"cursor": "default",
"fontSize": "11px"
},
"useHTML": false
}
},
"zAxis": {
"title": {
"text": "Multi Score"
}
},
"plotOptions": {
"series": {
"dataLabels": {
"enabled": false,
"format": null,
"distance": 30,
"align": "center",
"inside": null,
"allowOverlap": false,
"style": {
"fontSize": "11px"
}
},
"showInLegend": null,
"turboThreshold": 0,
"stacking": "",
"groupPadding": 0.2,
"centerInCategory": false,
"findNearestPointBy": "x"
}
},
"navigator": {
"enabled": false
},
"scrollbar": {
"enabled": false
},
"rangeSelector": {
"enabled": false,
"inputEnabled": false
},
"legend": {
"enabled": null,
"maxHeight": null,
"align": "center",
"verticalAlign": "bottom",
"layout": "horizontal",
"width": null,
"margin": 12,
"reversed": false
},
"series": [
{
"name": "r6a.large by Amazon Web Services",
"color": "#f7981d",
"data": [
{
"x": 1291.9497585718648,
"y": 1589.3554607212573
},
{
"x": 1261.2010292661178,
"y": 1560.721824606658
},
{
"x": 1302.3941179029475,
"y": 1640.8840724533907
},
{
"x": 1263.106971073229,
"y": 1597.870760783938
},
{
"x": 1307.8106768094156,
"y": 1615.9949057301055
},
{
"x": 1263.9735300921154,
"y": 1567.7666053490407
},
{
"x": 1303.5875783984875,
"y": 1607.5144789420697
},
{
"x": 1265.0270863170003,
"y": 1564.503256955345
},
{
"x": 1310.0574402804953,
"y": 1639.3427751266781
},
{
"x": 1261.9469224129932,
"y": 1574.3802290641918
},
{
"x": 1312.226009844553,
"y": 1615.066308770484
},
{
"x": 1253.4362441155704,
"y": 1600.7180783250135
},
{
"x": 1309.6391738489267,
"y": 1637.4870319728755
},
{
"x": 1262.7747364228646,
"y": 1568.2181873059144
},
{
"x": 1313.2126216750046,
"y": 1641.0444764025
},
{
"x": 1265.5043631261558,
"y": 1603.9190015405527
},
{
"x": 1299.0729430768777,
"y": 1620.5882535343494
},
{
"x": 1254.9456370602857,
"y": 1600.4702871137308
},
{
"x": 1307.1750253387206,
"y": 1640.675746935226
},
{
"x": 1260.662045990291,
"y": 1588.611960615311
}
]
}
],
"drilldown": {},
"tooltip": {
"enabled": true,
"useHTML": false,
"format": null,
"headerFormat": "",
"pointFormat": "<span style=\"color:{series.color}\">Single</span>: <b>{point.x:.0f}</b><br><span style=\"color:{series.color}\">Multi</span>: <b>{point.y:.0f}</b>",
"footerFormat": "",
"shared": false,
"outside": false,
"valueDecimals": null,
"split": false
},
"annotations": null
},
"hc_type": "chart",
"id": "71261176673814402350004266144848588623"
}
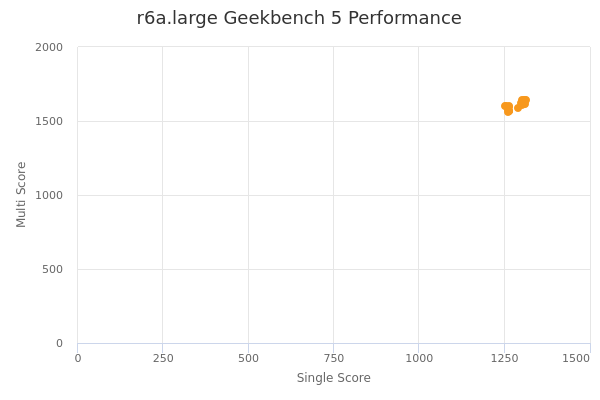
| Single | Multi | |
|---|---|---|
| Max | 1313 | 1641 |
| Average | 1283 | 1604 |
| Deviation | 22.82 | 26.85 |
| Min | 1253 | 1561 |
Sign up as Freemium to get more insight.