r6a.4xlarge by Amazon Web Services
Geekbench is a cross-platform processor benchmark with a scoring system that determines single-core and multi-core performance using loads simulating real-world scenarios. Geekbench 5 score is calculated with a reference score of 2500 representing the performance of the Intel Core i5-2520M @ 2.50 GHz. The software benchmark is available for Mac OS, Windows, Linux, Android and iOS platforms.
Specifications:
CPU
16
RAM
128.0 GB
Net
12000 Mbps
{
"configuration": {
"chart": {
"type": "scatter",
"polar": false,
"zoomType": "",
"options3d": {},
"height": null,
"width": null,
"margin": null,
"inverted": false,
"zooming": {}
},
"credits": {
"enabled": false
},
"title": {
"text": ""
},
"colorAxis": null,
"subtitle": {
"text": ""
},
"xAxis": {
"title": {
"text": [
"Single Score"
],
"useHTML": false,
"style": {
"color": "#666666"
}
},
"categories": null,
"lineWidth": 1,
"tickInterval": null,
"tickWidth": 1,
"tickLength": 10,
"tickPixelInterval": 100,
"plotLines": null,
"labels": {
"enabled": true,
"format": null,
"formatter": "",
"style": {
"color": "#666666",
"cursor": "default",
"fontSize": "11px"
},
"useHTML": false,
"step": 0
},
"plotBands": null,
"visible": true,
"floor": null,
"ceiling": null,
"type": "linear",
"min": 0,
"gridLineWidth": 1,
"gridLineColor": "#e6e6e6",
"minorTickInterval": null,
"minorTickWidth": 0,
"minTickInterval": null,
"startOnTick": true,
"endOnTick": true,
"tickmarkPlacement": 100,
"units": 100,
"minRange": 100
},
"yAxis": {
"title": {
"text": [
"Multi Score"
],
"useHTML": false,
"style": {
"color": "#666666"
}
},
"categories": null,
"plotLines": null,
"plotBands": null,
"lineWidth": null,
"tickInterval": null,
"tickLength": 10,
"floor": null,
"ceiling": null,
"gridLineInterpolation": null,
"gridLineWidth": 1,
"gridLineColor": "#e6e6e6",
"min": 0,
"max": null,
"minorTickInterval": null,
"minorTickWidth": 0,
"minTickInterval": null,
"startOnTick": true,
"endOnTick": true,
"minRange": null,
"type": "linear",
"tickmarkPlacement": null,
"labels": {
"enabled": true,
"formatter": null,
"style": {
"color": "#666666",
"cursor": "default",
"fontSize": "11px"
},
"useHTML": false
}
},
"zAxis": {
"title": {
"text": "Multi Score"
}
},
"plotOptions": {
"series": {
"dataLabels": {
"enabled": false,
"format": null,
"distance": 30,
"align": "center",
"inside": null,
"allowOverlap": false,
"style": {
"fontSize": "11px"
}
},
"showInLegend": null,
"turboThreshold": 0,
"stacking": "",
"groupPadding": 0.2,
"centerInCategory": false,
"findNearestPointBy": "x"
}
},
"navigator": {
"enabled": false
},
"scrollbar": {
"enabled": false
},
"rangeSelector": {
"enabled": false,
"inputEnabled": false
},
"legend": {
"enabled": null,
"maxHeight": null,
"align": "center",
"verticalAlign": "bottom",
"layout": "horizontal",
"width": null,
"margin": 12,
"reversed": false
},
"series": [
{
"name": "r6a.4xlarge by Amazon Web Services",
"color": "#f7981d",
"data": [
{
"x": 1054.6212543958989,
"y": 8443.551363362027
},
{
"x": 942.0856587681012,
"y": 8125.614269697351
},
{
"x": 1074.2871580315252,
"y": 8294.380693777792
},
{
"x": 1121.0055127455312,
"y": 8749.485305103011
},
{
"x": 1108.376643547685,
"y": 8582.121510595958
},
{
"x": 1082.8058131809116,
"y": 8453.426151057978
},
{
"x": 1040.2574436408827,
"y": 8357.618492498046
},
{
"x": 1078.8503685865803,
"y": 8018.82210491793
},
{
"x": 1122.0451615055836,
"y": 8576.392100633064
},
{
"x": 986.4295225671017,
"y": 8272.75100305643
},
{
"x": 1085.9649904690605,
"y": 8440.247014569606
},
{
"x": 1065.4590766197412,
"y": 8613.532714164128
},
{
"x": 1121.3091366316612,
"y": 8708.34297925294
},
{
"x": 899.8559960253363,
"y": 8251.008365900876
},
{
"x": 1062.2663084816813,
"y": 8728.905815628612
},
{
"x": 1002.6687980588259,
"y": 8580.57297735514
},
{
"x": 1070.497903225521,
"y": 8856.659523468934
},
{
"x": 1102.912373208043,
"y": 7863.7331509028145
},
{
"x": 1081.3751677275948,
"y": 8536.399846482893
},
{
"x": 1005.2037745599729,
"y": 8169.982386637819
}
]
}
],
"drilldown": {},
"tooltip": {
"enabled": true,
"useHTML": false,
"format": null,
"headerFormat": "",
"pointFormat": "<span style=\"color:{series.color}\">Single</span>: <b>{point.x:.0f}</b><br><span style=\"color:{series.color}\">Multi</span>: <b>{point.y:.0f}</b>",
"footerFormat": "",
"shared": false,
"outside": false,
"valueDecimals": null,
"split": false
},
"annotations": null
},
"hc_type": "chart",
"id": "266669007832550160317530042565745617075"
}
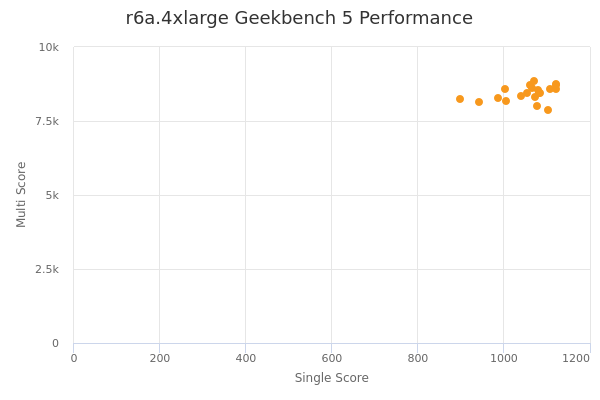
| Single | Multi | |
|---|---|---|
| Max | 1122 | 8857 |
| Average | 1055 | 8431 |
| Deviation | 58.79 | 254.40 |
| Min | 900 | 7864 |
Sign up as Freemium to get more insight.