c5d.xlarge by Amazon Web Services
Geekbench is a cross-platform processor benchmark with a scoring system that determines single-core and multi-core performance using loads simulating real-world scenarios. Geekbench 5 score is calculated with a reference score of 2500 representing the performance of the Intel Core i5-2520M @ 2.50 GHz. The software benchmark is available for Mac OS, Windows, Linux, Android and iOS platforms.
Specifications:
CPU
4
RAM
8.0 GB
Extra
1x
100 GB
NVMe SSD
Net
10000 Mbps
{
"configuration": {
"chart": {
"type": "scatter",
"polar": false,
"zoomType": "",
"options3d": {},
"height": null,
"width": null,
"margin": null,
"inverted": false,
"zooming": {}
},
"credits": {
"enabled": false
},
"title": {
"text": ""
},
"colorAxis": null,
"subtitle": {
"text": ""
},
"xAxis": {
"title": {
"text": [
"Single Score"
],
"useHTML": false,
"style": {
"color": "#666666"
}
},
"categories": null,
"lineWidth": 1,
"tickInterval": null,
"tickWidth": 1,
"tickLength": 10,
"tickPixelInterval": 100,
"plotLines": null,
"labels": {
"enabled": true,
"format": null,
"formatter": "",
"style": {
"color": "#666666",
"cursor": "default",
"fontSize": "11px"
},
"useHTML": false,
"step": 0
},
"plotBands": null,
"visible": true,
"floor": null,
"ceiling": null,
"type": "linear",
"min": 0,
"gridLineWidth": 1,
"gridLineColor": "#e6e6e6",
"minorTickInterval": null,
"minorTickWidth": 0,
"minTickInterval": null,
"startOnTick": true,
"endOnTick": true,
"tickmarkPlacement": 100,
"units": 100,
"minRange": 100
},
"yAxis": {
"title": {
"text": [
"Multi Score"
],
"useHTML": false,
"style": {
"color": "#666666"
}
},
"categories": null,
"plotLines": null,
"plotBands": null,
"lineWidth": null,
"tickInterval": null,
"tickLength": 10,
"floor": null,
"ceiling": null,
"gridLineInterpolation": null,
"gridLineWidth": 1,
"gridLineColor": "#e6e6e6",
"min": 0,
"max": null,
"minorTickInterval": null,
"minorTickWidth": 0,
"minTickInterval": null,
"startOnTick": true,
"endOnTick": true,
"minRange": null,
"type": "linear",
"tickmarkPlacement": null,
"labels": {
"enabled": true,
"formatter": null,
"style": {
"color": "#666666",
"cursor": "default",
"fontSize": "11px"
},
"useHTML": false
}
},
"zAxis": {
"title": {
"text": "Multi Score"
}
},
"plotOptions": {
"series": {
"dataLabels": {
"enabled": false,
"format": null,
"distance": 30,
"align": "center",
"inside": null,
"allowOverlap": false,
"style": {
"fontSize": "11px"
}
},
"showInLegend": null,
"turboThreshold": 0,
"stacking": "",
"groupPadding": 0.2,
"centerInCategory": false,
"findNearestPointBy": "x"
}
},
"navigator": {
"enabled": false
},
"scrollbar": {
"enabled": false
},
"rangeSelector": {
"enabled": false,
"inputEnabled": false
},
"legend": {
"enabled": null,
"maxHeight": null,
"align": "center",
"verticalAlign": "bottom",
"layout": "horizontal",
"width": null,
"margin": 12,
"reversed": false
},
"series": [
{
"name": "c5d.xlarge by Amazon Web Services",
"color": "#f7981d",
"data": [
{
"x": 930.987910613641,
"y": 2202.3972590182098
},
{
"x": 920.469940324349,
"y": 2194.8530933640677
},
{
"x": 938.3517582091838,
"y": 2202.289791712572
},
{
"x": 923.077960714523,
"y": 2225.4577266548995
},
{
"x": 942.4308055667927,
"y": 2185.3118175486757
},
{
"x": 932.9821054698526,
"y": 2233.6115137084307
},
{
"x": 944.1389436286843,
"y": 2195.5709108206074
},
{
"x": 953.3956311917532,
"y": 2250.396609623888
},
{
"x": 941.6117491989228,
"y": 2179.295626188836
},
{
"x": 953.6677021762539,
"y": 2271.859518309732
},
{
"x": 979.3729070168904,
"y": 2296.457307900654
},
{
"x": 936.4078963960285,
"y": 2195.758757217986
},
{
"x": 969.2055345081259,
"y": 2295.256839129095
},
{
"x": 930.3979704142114,
"y": 2193.4820063674492
},
{
"x": 969.2381380126726,
"y": 2299.5803158194376
},
{
"x": 943.6051777290776,
"y": 2182.294365283685
},
{
"x": 986.3598408090554,
"y": 2301.740494869561
},
{
"x": 916.4090772065287,
"y": 2156.2913769237216
},
{
"x": 986.0886799144423,
"y": 2300.0474555280275
},
{
"x": 914.7065273647449,
"y": 2191.0392706478206
},
{
"x": 986.2988463857757,
"y": 2295.8816132448324
},
{
"x": 905.1753068388833,
"y": 2181.6505039451017
},
{
"x": 984.9424287857994,
"y": 2304.1205281158195
},
{
"x": 920.0626629882736,
"y": 2169.384616199747
},
{
"x": 982.6609066996408,
"y": 2304.213026130904
},
{
"x": 928.4191982254656,
"y": 2206.2481228882416
},
{
"x": 985.8011785905635,
"y": 2300.6329227027736
},
{
"x": 945.709789974411,
"y": 2210.194862939582
},
{
"x": 978.2300449011956,
"y": 2293.4216814276097
},
{
"x": 929.015286491504,
"y": 2203.5997679844177
},
{
"x": 976.2539633454251,
"y": 2297.398209921244
},
{
"x": 946.319088716418,
"y": 2177.868695303946
},
{
"x": 979.4955091951758,
"y": 2297.006620972653
},
{
"x": 946.2389770634636,
"y": 2209.8692306267576
},
{
"x": 976.2720109748207,
"y": 2296.932359193589
},
{
"x": 941.0022763758789,
"y": 2186.377013666073
},
{
"x": 980.0135243003119,
"y": 2297.3044427846353
},
{
"x": 945.3817200568387,
"y": 2204.468206642701
},
{
"x": 976.4600210874377,
"y": 2289.222736427283
},
{
"x": 929.7860645085949,
"y": 2213.53910872291
},
{
"x": 980.4977915446317,
"y": 2298.96545551451
},
{
"x": 930.2485706745365,
"y": 2207.2075083796212
},
{
"x": 977.5400119748035,
"y": 2296.1391838085888
},
{
"x": 920.0931989355431,
"y": 2175.0816292561713
},
{
"x": 979.7648778341205,
"y": 2301.578944941708
},
{
"x": 936.5604081024098,
"y": 2202.278976294603
},
{
"x": 984.2617510265786,
"y": 2306.8136520779844
},
{
"x": 917.4766122068305,
"y": 2176.8041006013286
},
{
"x": 974.9218708736621,
"y": 2300.5389851199866
},
{
"x": 941.9743486963459,
"y": 2208.5547217464527
}
]
}
],
"drilldown": {},
"tooltip": {
"enabled": true,
"useHTML": false,
"format": null,
"headerFormat": "",
"pointFormat": "<span style=\"color:{series.color}\">Single</span>: <b>{point.x:.0f}</b><br><span style=\"color:{series.color}\">Multi</span>: <b>{point.y:.0f}</b>",
"footerFormat": "",
"shared": false,
"outside": false,
"valueDecimals": null,
"split": false
},
"annotations": null
},
"hc_type": "chart",
"id": "24153018597859169827146561629961714838"
}
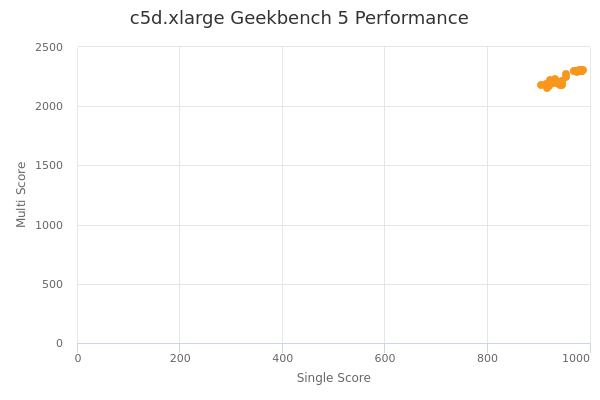
| Single | Multi | |
|---|---|---|
| Max | 986 | 2307 |
| Average | 952 | 2239 |
| Deviation | 24.67 | 51.75 |
| Min | 905 | 2156 |
Sign up as Freemium to get more insight.