c5d.12xlarge by Amazon Web Services
Geekbench is a cross-platform processor benchmark with a scoring system that determines single-core and multi-core performance using loads simulating real-world scenarios. Geekbench 5 score is calculated with a reference score of 2500 representing the performance of the Intel Core i5-2520M @ 2.50 GHz. The software benchmark is available for Mac OS, Windows, Linux, Android and iOS platforms.
Specifications:
CPU
48
RAM
96.0 GB
Extra
2x
900 GB
NVMe SSD
Net
12000 Mbps
{
"configuration": {
"chart": {
"type": "scatter",
"polar": false,
"zoomType": "",
"options3d": {},
"height": null,
"width": null,
"margin": null,
"inverted": false,
"zooming": {}
},
"credits": {
"enabled": false
},
"title": {
"text": ""
},
"colorAxis": null,
"subtitle": {
"text": ""
},
"xAxis": {
"title": {
"text": [
"Single Score"
],
"useHTML": false,
"style": {
"color": "#666666"
}
},
"categories": null,
"lineWidth": 1,
"tickInterval": null,
"tickWidth": 1,
"tickLength": 10,
"tickPixelInterval": 100,
"plotLines": null,
"labels": {
"enabled": true,
"format": null,
"formatter": "",
"style": {
"color": "#666666",
"cursor": "default",
"fontSize": "11px"
},
"useHTML": false,
"step": 0
},
"plotBands": null,
"visible": true,
"floor": null,
"ceiling": null,
"type": "linear",
"min": 0,
"gridLineWidth": 1,
"gridLineColor": "#e6e6e6",
"minorTickInterval": null,
"minorTickWidth": 0,
"minTickInterval": null,
"startOnTick": true,
"endOnTick": true,
"tickmarkPlacement": 100,
"units": 100,
"minRange": 100
},
"yAxis": {
"title": {
"text": [
"Multi Score"
],
"useHTML": false,
"style": {
"color": "#666666"
}
},
"categories": null,
"plotLines": null,
"plotBands": null,
"lineWidth": null,
"tickInterval": null,
"tickLength": 10,
"floor": null,
"ceiling": null,
"gridLineInterpolation": null,
"gridLineWidth": 1,
"gridLineColor": "#e6e6e6",
"min": 0,
"max": null,
"minorTickInterval": null,
"minorTickWidth": 0,
"minTickInterval": null,
"startOnTick": true,
"endOnTick": true,
"minRange": null,
"type": "linear",
"tickmarkPlacement": null,
"labels": {
"enabled": true,
"formatter": null,
"style": {
"color": "#666666",
"cursor": "default",
"fontSize": "11px"
},
"useHTML": false
}
},
"zAxis": {
"title": {
"text": "Multi Score"
}
},
"plotOptions": {
"series": {
"dataLabels": {
"enabled": false,
"format": null,
"distance": 30,
"align": "center",
"inside": null,
"allowOverlap": false,
"style": {
"fontSize": "11px"
}
},
"showInLegend": null,
"turboThreshold": 0,
"stacking": "",
"groupPadding": 0.2,
"centerInCategory": false,
"findNearestPointBy": "x"
}
},
"navigator": {
"enabled": false
},
"scrollbar": {
"enabled": false
},
"rangeSelector": {
"enabled": false,
"inputEnabled": false
},
"legend": {
"enabled": null,
"maxHeight": null,
"align": "center",
"verticalAlign": "bottom",
"layout": "horizontal",
"width": null,
"margin": 12,
"reversed": false
},
"series": [
{
"name": "c5d.12xlarge by Amazon Web Services",
"color": "#f7981d",
"data": [
{
"x": 1079.2913659807678,
"y": 22002.90122748406
},
{
"x": 1077.8900910758061,
"y": 21793.564542633176
},
{
"x": 1074.2388610312616,
"y": 22104.663539226436
},
{
"x": 1077.1081168936607,
"y": 21716.245504960672
},
{
"x": 1075.117664427985,
"y": 21993.595728979555
},
{
"x": 1078.6131703262688,
"y": 21737.87855720873
},
{
"x": 1075.711387378773,
"y": 22044.459567680817
},
{
"x": 1080.0131042138833,
"y": 21795.72467013931
},
{
"x": 1072.2151608264824,
"y": 21948.5170237462
},
{
"x": 1076.0635538675533,
"y": 21730.544590425678
},
{
"x": 1074.7689570337825,
"y": 21867.048814139926
},
{
"x": 1076.4091280290918,
"y": 21826.170669717132
},
{
"x": 1074.830263643206,
"y": 21938.99619243197
},
{
"x": 1076.5954448387224,
"y": 21765.662638740858
},
{
"x": 1072.272608240306,
"y": 21964.042456936284
},
{
"x": 1076.3606572703327,
"y": 21753.219387615227
},
{
"x": 1078.7462254975849,
"y": 22071.25153614439
},
{
"x": 1076.7508109081791,
"y": 21764.41756372145
},
{
"x": 1073.7091998223852,
"y": 22043.784958324675
},
{
"x": 1077.2907162412396,
"y": 21721.075267545235
}
]
}
],
"drilldown": {},
"tooltip": {
"enabled": true,
"useHTML": false,
"format": null,
"headerFormat": "",
"pointFormat": "<span style=\"color:{series.color}\">Single</span>: <b>{point.x:.0f}</b><br><span style=\"color:{series.color}\">Multi</span>: <b>{point.y:.0f}</b>",
"footerFormat": "",
"shared": false,
"outside": false,
"valueDecimals": null,
"split": false
},
"annotations": null
},
"hc_type": "chart",
"id": "109667745527023660132620632494442758870"
}
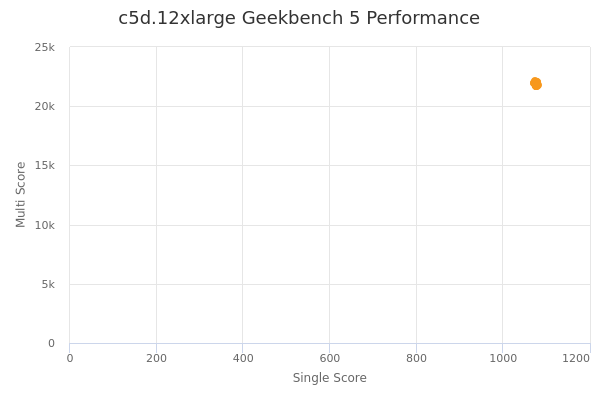
| Single | Multi | |
|---|---|---|
| Max | 1080 | 22105 |
| Average | 1076 | 21879 |
| Deviation | 2.10 | 130.17 |
| Min | 1072 | 21716 |
Sign up as Freemium to get more insight.