c5d.18xlarge by Amazon Web Services
Geekbench is a cross-platform processor benchmark with a scoring system that determines single-core and multi-core performance using loads simulating real-world scenarios. Geekbench 5 score is calculated with a reference score of 2500 representing the performance of the Intel Core i5-2520M @ 2.50 GHz. The software benchmark is available for Mac OS, Windows, Linux, Android and iOS platforms.
Specifications:
CPU
72
RAM
144.0 GB
Extra
2x
900 GB
NVMe SSD
Net
25000 Mbps
{
"configuration": {
"chart": {
"type": "scatter",
"polar": false,
"zoomType": "",
"options3d": {},
"height": null,
"width": null,
"margin": null,
"inverted": false,
"zooming": {}
},
"credits": {
"enabled": false
},
"title": {
"text": ""
},
"colorAxis": null,
"subtitle": {
"text": ""
},
"xAxis": {
"title": {
"text": [
"Single Score"
],
"useHTML": false,
"style": {
"color": "#666666"
}
},
"categories": null,
"lineWidth": 1,
"tickInterval": null,
"tickWidth": 1,
"tickLength": 10,
"tickPixelInterval": 100,
"plotLines": null,
"labels": {
"enabled": true,
"format": null,
"formatter": "",
"style": {
"color": "#666666",
"cursor": "default",
"fontSize": "11px"
},
"useHTML": false,
"step": 0
},
"plotBands": null,
"visible": true,
"floor": null,
"ceiling": null,
"type": "linear",
"min": 0,
"gridLineWidth": 1,
"gridLineColor": "#e6e6e6",
"minorTickInterval": null,
"minorTickWidth": 0,
"minTickInterval": null,
"startOnTick": true,
"endOnTick": true,
"tickmarkPlacement": 100,
"units": 100,
"minRange": 100
},
"yAxis": {
"title": {
"text": [
"Multi Score"
],
"useHTML": false,
"style": {
"color": "#666666"
}
},
"categories": null,
"plotLines": null,
"plotBands": null,
"lineWidth": null,
"tickInterval": null,
"tickLength": 10,
"floor": null,
"ceiling": null,
"gridLineInterpolation": null,
"gridLineWidth": 1,
"gridLineColor": "#e6e6e6",
"min": 0,
"max": null,
"minorTickInterval": null,
"minorTickWidth": 0,
"minTickInterval": null,
"startOnTick": true,
"endOnTick": true,
"minRange": null,
"type": "linear",
"tickmarkPlacement": null,
"labels": {
"enabled": true,
"formatter": null,
"style": {
"color": "#666666",
"cursor": "default",
"fontSize": "11px"
},
"useHTML": false
}
},
"zAxis": {
"title": {
"text": "Multi Score"
}
},
"plotOptions": {
"series": {
"dataLabels": {
"enabled": false,
"format": null,
"distance": 30,
"align": "center",
"inside": null,
"allowOverlap": false,
"style": {
"fontSize": "11px"
}
},
"showInLegend": null,
"turboThreshold": 0,
"stacking": "",
"groupPadding": 0.2,
"centerInCategory": false,
"findNearestPointBy": "x"
}
},
"navigator": {
"enabled": false
},
"scrollbar": {
"enabled": false
},
"rangeSelector": {
"enabled": false,
"inputEnabled": false
},
"legend": {
"enabled": null,
"maxHeight": null,
"align": "center",
"verticalAlign": "bottom",
"layout": "horizontal",
"width": null,
"margin": 12,
"reversed": false
},
"series": [
{
"name": "c5d.18xlarge by Amazon Web Services",
"color": "#f7981d",
"data": [
{
"x": 971.1342552008588,
"y": 29611.81032225389
},
{
"x": 975.7708801757965,
"y": 28842.0999442113
},
{
"x": 973.2626037034723,
"y": 29456.699745457525
},
{
"x": 970.9509128291404,
"y": 28496.317979381325
},
{
"x": 973.8713237854395,
"y": 28930.065428503243
},
{
"x": 976.5637934499628,
"y": 28490.86774347624
},
{
"x": 974.9162181136758,
"y": 29050.621827746323
},
{
"x": 970.780136207673,
"y": 29021.6445110341
},
{
"x": 973.6372319009265,
"y": 29045.642762736865
},
{
"x": 974.2631903569812,
"y": 28244.28438099385
},
{
"x": 974.4688256892925,
"y": 28590.796443709252
},
{
"x": 974.5538554818154,
"y": 29087.5351687119
},
{
"x": 973.4220422883412,
"y": 29175.648323093825
},
{
"x": 974.1832138695142,
"y": 28610.438392330194
},
{
"x": 974.6256404866447,
"y": 29259.58116362856
},
{
"x": 975.4446776808363,
"y": 29226.75657447984
},
{
"x": 973.8754046552222,
"y": 28971.667111979274
},
{
"x": 970.5213123873002,
"y": 29402.21133145076
},
{
"x": 974.5412545172006,
"y": 28623.323177141938
},
{
"x": 974.6437404295633,
"y": 28858.47891621985
}
]
}
],
"drilldown": {},
"tooltip": {
"enabled": true,
"useHTML": false,
"format": null,
"headerFormat": "",
"pointFormat": "<span style=\"color:{series.color}\">Single</span>: <b>{point.x:.0f}</b><br><span style=\"color:{series.color}\">Multi</span>: <b>{point.y:.0f}</b>",
"footerFormat": "",
"shared": false,
"outside": false,
"valueDecimals": null,
"split": false
},
"annotations": null
},
"hc_type": "chart",
"id": "143183356658771635093277072020697261050"
}
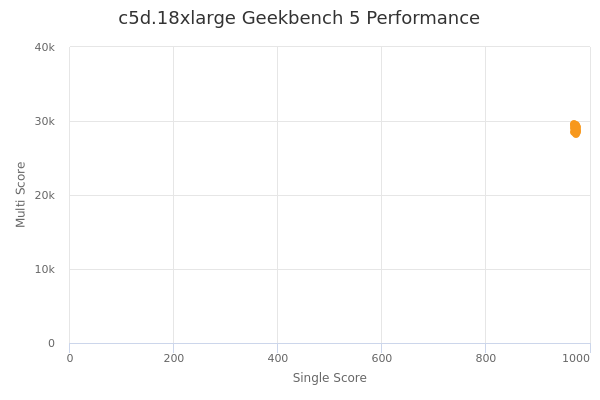
| Single | Multi | |
|---|---|---|
| Max | 977 | 29612 |
| Average | 974 | 28950 |
| Deviation | 1.65 | 350.18 |
| Min | 971 | 28244 |
Sign up as Freemium to get more insight.