c5d.9xlarge by Amazon Web Services
Geekbench is a cross-platform processor benchmark with a scoring system that determines single-core and multi-core performance using loads simulating real-world scenarios. Geekbench 5 score is calculated with a reference score of 2500 representing the performance of the Intel Core i5-2520M @ 2.50 GHz. The software benchmark is available for Mac OS, Windows, Linux, Android and iOS platforms.
Specifications:
CPU
36
RAM
72.0 GB
Extra
1x
900 GB
NVMe SSD
Net
10000 Mbps
{
"configuration": {
"chart": {
"type": "scatter",
"polar": false,
"zoomType": "",
"options3d": {},
"height": null,
"width": null,
"margin": null,
"inverted": false,
"zooming": {}
},
"credits": {
"enabled": false
},
"title": {
"text": ""
},
"colorAxis": null,
"subtitle": {
"text": ""
},
"xAxis": {
"title": {
"text": [
"Single Score"
],
"useHTML": false,
"style": {
"color": "#666666"
}
},
"categories": null,
"lineWidth": 1,
"tickInterval": null,
"tickWidth": 1,
"tickLength": 10,
"tickPixelInterval": 100,
"plotLines": null,
"labels": {
"enabled": true,
"format": null,
"formatter": "",
"style": {
"color": "#666666",
"cursor": "default",
"fontSize": "11px"
},
"useHTML": false,
"step": 0
},
"plotBands": null,
"visible": true,
"floor": null,
"ceiling": null,
"type": "linear",
"min": 0,
"gridLineWidth": 1,
"gridLineColor": "#e6e6e6",
"minorTickInterval": null,
"minorTickWidth": 0,
"minTickInterval": null,
"startOnTick": true,
"endOnTick": true,
"tickmarkPlacement": 100,
"units": 100,
"minRange": 100
},
"yAxis": {
"title": {
"text": [
"Multi Score"
],
"useHTML": false,
"style": {
"color": "#666666"
}
},
"categories": null,
"plotLines": null,
"plotBands": null,
"lineWidth": null,
"tickInterval": null,
"tickLength": 10,
"floor": null,
"ceiling": null,
"gridLineInterpolation": null,
"gridLineWidth": 1,
"gridLineColor": "#e6e6e6",
"min": 0,
"max": null,
"minorTickInterval": null,
"minorTickWidth": 0,
"minTickInterval": null,
"startOnTick": true,
"endOnTick": true,
"minRange": null,
"type": "linear",
"tickmarkPlacement": null,
"labels": {
"enabled": true,
"formatter": null,
"style": {
"color": "#666666",
"cursor": "default",
"fontSize": "11px"
},
"useHTML": false
}
},
"zAxis": {
"title": {
"text": "Multi Score"
}
},
"plotOptions": {
"series": {
"dataLabels": {
"enabled": false,
"format": null,
"distance": 30,
"align": "center",
"inside": null,
"allowOverlap": false,
"style": {
"fontSize": "11px"
}
},
"showInLegend": null,
"turboThreshold": 0,
"stacking": "",
"groupPadding": 0.2,
"centerInCategory": false,
"findNearestPointBy": "x"
}
},
"navigator": {
"enabled": false
},
"scrollbar": {
"enabled": false
},
"rangeSelector": {
"enabled": false,
"inputEnabled": false
},
"legend": {
"enabled": null,
"maxHeight": null,
"align": "center",
"verticalAlign": "bottom",
"layout": "horizontal",
"width": null,
"margin": 12,
"reversed": false
},
"series": [
{
"name": "c5d.9xlarge by Amazon Web Services",
"color": "#f7981d",
"data": [
{
"x": 983.143827724524,
"y": 16819.128756865997
},
{
"x": 975.4329317232699,
"y": 16827.025824457232
},
{
"x": 980.1726029945689,
"y": 16744.34474050921
},
{
"x": 979.8125651155731,
"y": 16791.638211987774
},
{
"x": 979.7760167485235,
"y": 16824.427400902372
},
{
"x": 982.3224832354415,
"y": 16784.848680605213
},
{
"x": 981.5309275598988,
"y": 16731.37877564168
},
{
"x": 979.9571631147282,
"y": 16829.20914077796
},
{
"x": 982.013103709608,
"y": 16776.730081273934
},
{
"x": 976.9345188039738,
"y": 16800.11793702366
},
{
"x": 982.8947976324548,
"y": 16782.073913609747
},
{
"x": 974.6627351262405,
"y": 16773.12593506255
},
{
"x": 978.0075866299183,
"y": 16763.96369545857
},
{
"x": 975.100299877578,
"y": 16755.60592844178
},
{
"x": 980.9799916724455,
"y": 16834.036712151843
},
{
"x": 975.7614759461496,
"y": 16778.05136983201
},
{
"x": 975.0617109905129,
"y": 16815.296131238047
},
{
"x": 975.2766183089619,
"y": 16800.489178027943
},
{
"x": 978.9380244250458,
"y": 16706.76917757702
},
{
"x": 976.4732381207307,
"y": 16724.171352554822
},
{
"x": 972.497011536568,
"y": 16620.689096267804
},
{
"x": 973.1873941162833,
"y": 16590.277458748682
},
{
"x": 972.7854608268397,
"y": 16582.08869762445
},
{
"x": 967.7461528301588,
"y": 16548.329588205444
},
{
"x": 971.2098570056467,
"y": 16559.99605342921
},
{
"x": 968.6832272770762,
"y": 16550.285573913712
},
{
"x": 970.0829891844257,
"y": 16584.703920757802
},
{
"x": 968.7373062007534,
"y": 16421.80745807276
},
{
"x": 971.0827873665,
"y": 16599.571571695244
},
{
"x": 968.7939711474241,
"y": 16535.50598306248
},
{
"x": 963.9759580081702,
"y": 16544.571027681992
},
{
"x": 969.3140984043986,
"y": 16543.002766015048
},
{
"x": 975.8886525083694,
"y": 16477.987258947363
},
{
"x": 972.8960183376166,
"y": 16565.616979485527
},
{
"x": 972.2233358831293,
"y": 16475.847038110005
},
{
"x": 969.2628153348054,
"y": 16553.430731133274
},
{
"x": 970.7673216327037,
"y": 16566.538359519825
},
{
"x": 969.0244397935821,
"y": 16529.451307832558
},
{
"x": 975.894315627041,
"y": 16540.39700078655
},
{
"x": 970.346277123724,
"y": 16579.624429327538
}
]
}
],
"drilldown": {},
"tooltip": {
"enabled": true,
"useHTML": false,
"format": null,
"headerFormat": "",
"pointFormat": "<span style=\"color:{series.color}\">Single</span>: <b>{point.x:.0f}</b><br><span style=\"color:{series.color}\">Multi</span>: <b>{point.y:.0f}</b>",
"footerFormat": "",
"shared": false,
"outside": false,
"valueDecimals": null,
"split": false
},
"annotations": null
},
"hc_type": "chart",
"id": "88470297553098854868806016365767901163"
}
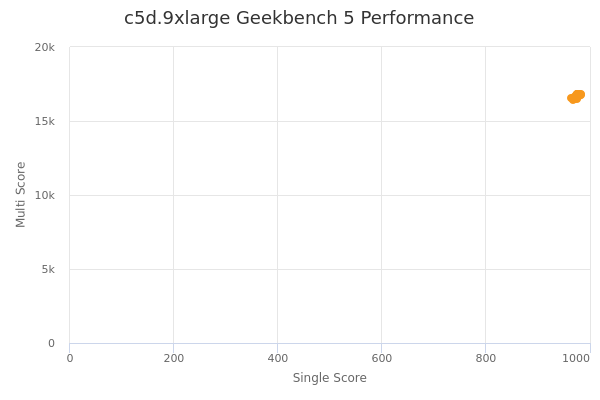
| Single | Multi | |
|---|---|---|
| Max | 983 | 16834 |
| Average | 975 | 16666 |
| Deviation | 4.87 | 124.23 |
| Min | 964 | 16422 |
Sign up as Freemium to get more insight.