c5d.4xlarge by Amazon Web Services
Geekbench is a cross-platform processor benchmark with a scoring system that determines single-core and multi-core performance using loads simulating real-world scenarios. Geekbench 5 score is calculated with a reference score of 2500 representing the performance of the Intel Core i5-2520M @ 2.50 GHz. The software benchmark is available for Mac OS, Windows, Linux, Android and iOS platforms.
Specifications:
CPU
16
RAM
32.0 GB
Extra
1x
400 GB
NVMe SSD
Net
10000 Mbps
{
"configuration": {
"chart": {
"type": "scatter",
"polar": false,
"zoomType": "",
"options3d": {},
"height": null,
"width": null,
"margin": null,
"inverted": false,
"zooming": {}
},
"credits": {
"enabled": false
},
"title": {
"text": ""
},
"colorAxis": null,
"subtitle": {
"text": ""
},
"xAxis": {
"title": {
"text": [
"Single Score"
],
"useHTML": false,
"style": {
"color": "#666666"
}
},
"categories": null,
"lineWidth": 1,
"tickInterval": null,
"tickWidth": 1,
"tickLength": 10,
"tickPixelInterval": 100,
"plotLines": null,
"labels": {
"enabled": true,
"format": null,
"formatter": "",
"style": {
"color": "#666666",
"cursor": "default",
"fontSize": "11px"
},
"useHTML": false,
"step": 0
},
"plotBands": null,
"visible": true,
"floor": null,
"ceiling": null,
"type": "linear",
"min": 0,
"gridLineWidth": 1,
"gridLineColor": "#e6e6e6",
"minorTickInterval": null,
"minorTickWidth": 0,
"minTickInterval": null,
"startOnTick": true,
"endOnTick": true,
"tickmarkPlacement": 100,
"units": 100,
"minRange": 100
},
"yAxis": {
"title": {
"text": [
"Multi Score"
],
"useHTML": false,
"style": {
"color": "#666666"
}
},
"categories": null,
"plotLines": null,
"plotBands": null,
"lineWidth": null,
"tickInterval": null,
"tickLength": 10,
"floor": null,
"ceiling": null,
"gridLineInterpolation": null,
"gridLineWidth": 1,
"gridLineColor": "#e6e6e6",
"min": 0,
"max": null,
"minorTickInterval": null,
"minorTickWidth": 0,
"minTickInterval": null,
"startOnTick": true,
"endOnTick": true,
"minRange": null,
"type": "linear",
"tickmarkPlacement": null,
"labels": {
"enabled": true,
"formatter": null,
"style": {
"color": "#666666",
"cursor": "default",
"fontSize": "11px"
},
"useHTML": false
}
},
"zAxis": {
"title": {
"text": "Multi Score"
}
},
"plotOptions": {
"series": {
"dataLabels": {
"enabled": false,
"format": null,
"distance": 30,
"align": "center",
"inside": null,
"allowOverlap": false,
"style": {
"fontSize": "11px"
}
},
"showInLegend": null,
"turboThreshold": 0,
"stacking": "",
"groupPadding": 0.2,
"centerInCategory": false,
"findNearestPointBy": "x"
}
},
"navigator": {
"enabled": false
},
"scrollbar": {
"enabled": false
},
"rangeSelector": {
"enabled": false,
"inputEnabled": false
},
"legend": {
"enabled": null,
"maxHeight": null,
"align": "center",
"verticalAlign": "bottom",
"layout": "horizontal",
"width": null,
"margin": 12,
"reversed": false
},
"series": [
{
"name": "c5d.4xlarge by Amazon Web Services",
"color": "#f7981d",
"data": [
{
"x": 967.6319300319951,
"y": 8415.42660454501
},
{
"x": 943.3713540551166,
"y": 8392.720307440364
},
{
"x": 964.94575926654,
"y": 8408.76976412689
},
{
"x": 945.7061186641479,
"y": 8371.59206395133
},
{
"x": 968.4293201745903,
"y": 8430.99436027418
},
{
"x": 948.5113757598618,
"y": 8337.183312208872
},
{
"x": 965.8358152876165,
"y": 8391.881702981085
},
{
"x": 947.3359542989315,
"y": 8340.711443155751
},
{
"x": 970.5220121943995,
"y": 8398.708711714784
},
{
"x": 943.2506920323544,
"y": 8344.560420327103
},
{
"x": 970.6744099382017,
"y": 8427.598570817601
},
{
"x": 946.8150907854972,
"y": 8386.6947568981
},
{
"x": 970.743601585218,
"y": 8443.109579782858
},
{
"x": 946.6264214582595,
"y": 8338.329178261756
},
{
"x": 965.0540273129538,
"y": 8381.428330796896
},
{
"x": 950.4391318218527,
"y": 8330.505644260309
},
{
"x": 969.9230889162,
"y": 8411.845369578958
},
{
"x": 944.5594739850039,
"y": 8332.858760910525
},
{
"x": 971.0964713542837,
"y": 8399.298674763566
},
{
"x": 947.6601737991305,
"y": 8348.22908552292
}
]
}
],
"drilldown": {},
"tooltip": {
"enabled": true,
"useHTML": false,
"format": null,
"headerFormat": "",
"pointFormat": "<span style=\"color:{series.color}\">Single</span>: <b>{point.x:.0f}</b><br><span style=\"color:{series.color}\">Multi</span>: <b>{point.y:.0f}</b>",
"footerFormat": "",
"shared": false,
"outside": false,
"valueDecimals": null,
"split": false
},
"annotations": null
},
"hc_type": "chart",
"id": "69323507089065511490442319303626641015"
}
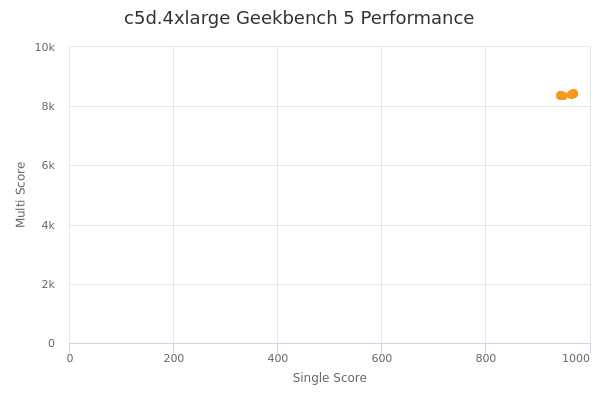
| Single | Multi | |
|---|---|---|
| Max | 971 | 8443 |
| Average | 957 | 8382 |
| Deviation | 11.26 | 35.42 |
| Min | 943 | 8331 |
Sign up as Freemium to get more insight.