c5d.metal by Amazon Web Services
Geekbench is a cross-platform processor benchmark with a scoring system that determines single-core and multi-core performance using loads simulating real-world scenarios. Geekbench 5 score is calculated with a reference score of 2500 representing the performance of the Intel Core i5-2520M @ 2.50 GHz. The software benchmark is available for Mac OS, Windows, Linux, Android and iOS platforms.
Specifications:
CPU
96
RAM
192.0 GB
Extra
4x
900 GB
SSD
Net
25000 Mbps
{
"configuration": {
"chart": {
"type": "scatter",
"polar": false,
"zoomType": "",
"options3d": {},
"height": null,
"width": null,
"margin": null,
"inverted": false,
"zooming": {}
},
"credits": {
"enabled": false
},
"title": {
"text": ""
},
"colorAxis": null,
"subtitle": {
"text": ""
},
"xAxis": {
"title": {
"text": [
"Single Score"
],
"useHTML": false,
"style": {
"color": "#666666"
}
},
"categories": null,
"lineWidth": 1,
"tickInterval": null,
"tickWidth": 1,
"tickLength": 10,
"tickPixelInterval": 100,
"plotLines": null,
"labels": {
"enabled": true,
"format": null,
"formatter": "",
"style": {
"color": "#666666",
"cursor": "default",
"fontSize": "11px"
},
"useHTML": false,
"step": 0
},
"plotBands": null,
"visible": true,
"floor": null,
"ceiling": null,
"type": "linear",
"min": 0,
"gridLineWidth": 1,
"gridLineColor": "#e6e6e6",
"minorTickInterval": null,
"minorTickWidth": 0,
"minTickInterval": null,
"startOnTick": true,
"endOnTick": true,
"tickmarkPlacement": 100,
"units": 100,
"minRange": 100
},
"yAxis": {
"title": {
"text": [
"Multi Score"
],
"useHTML": false,
"style": {
"color": "#666666"
}
},
"categories": null,
"plotLines": null,
"plotBands": null,
"lineWidth": null,
"tickInterval": null,
"tickLength": 10,
"floor": null,
"ceiling": null,
"gridLineInterpolation": null,
"gridLineWidth": 1,
"gridLineColor": "#e6e6e6",
"min": 0,
"max": null,
"minorTickInterval": null,
"minorTickWidth": 0,
"minTickInterval": null,
"startOnTick": true,
"endOnTick": true,
"minRange": null,
"type": "linear",
"tickmarkPlacement": null,
"labels": {
"enabled": true,
"formatter": null,
"style": {
"color": "#666666",
"cursor": "default",
"fontSize": "11px"
},
"useHTML": false
}
},
"zAxis": {
"title": {
"text": "Multi Score"
}
},
"plotOptions": {
"series": {
"dataLabels": {
"enabled": false,
"format": null,
"distance": 30,
"align": "center",
"inside": null,
"allowOverlap": false,
"style": {
"fontSize": "11px"
}
},
"showInLegend": null,
"turboThreshold": 0,
"stacking": "",
"groupPadding": 0.2,
"centerInCategory": false,
"findNearestPointBy": "x"
}
},
"navigator": {
"enabled": false
},
"scrollbar": {
"enabled": false
},
"rangeSelector": {
"enabled": false,
"inputEnabled": false
},
"legend": {
"enabled": null,
"maxHeight": null,
"align": "center",
"verticalAlign": "bottom",
"layout": "horizontal",
"width": null,
"margin": 12,
"reversed": false
},
"series": [
{
"name": "c5d.metal by Amazon Web Services",
"color": "#f7981d",
"data": [
{
"x": 1121.569068267493,
"y": 38053.07436644893
},
{
"x": 1121.1120775127952,
"y": 37634.18227936654
},
{
"x": 1116.6966546788187,
"y": 37170.61921685394
},
{
"x": 1112.5364754160998,
"y": 37213.19310117804
},
{
"x": 1115.869573991241,
"y": 37071.02616733759
},
{
"x": 1120.6378766533712,
"y": 37170.56916613742
},
{
"x": 1118.6359195899943,
"y": 35798.82582689137
},
{
"x": 1113.4841580903321,
"y": 36964.38650886534
},
{
"x": 1118.6774763941637,
"y": 36856.46529866721
},
{
"x": 1116.9864958257137,
"y": 37302.43507471545
},
{
"x": 1114.8001976059452,
"y": 36472.62533809885
},
{
"x": 1116.1839741049228,
"y": 38033.11112552123
},
{
"x": 1117.411830514995,
"y": 36280.35423583605
},
{
"x": 1119.1587827600836,
"y": 36903.382702897274
},
{
"x": 1115.0286214301589,
"y": 37617.749438100334
},
{
"x": 1118.3568193573649,
"y": 36546.64946001364
},
{
"x": 1119.6630760614069,
"y": 36726.55637053744
},
{
"x": 1121.1229882624841,
"y": 35902.40670383512
},
{
"x": 1115.5486094172636,
"y": 37334.85897377799
},
{
"x": 1116.7061469017065,
"y": 37184.306468903844
}
]
}
],
"drilldown": {},
"tooltip": {
"enabled": true,
"useHTML": false,
"format": null,
"headerFormat": "",
"pointFormat": "<span style=\"color:{series.color}\">Single</span>: <b>{point.x:.0f}</b><br><span style=\"color:{series.color}\">Multi</span>: <b>{point.y:.0f}</b>",
"footerFormat": "",
"shared": false,
"outside": false,
"valueDecimals": null,
"split": false
},
"annotations": null
},
"hc_type": "chart",
"id": "261359448371906784287115982016133109813"
}
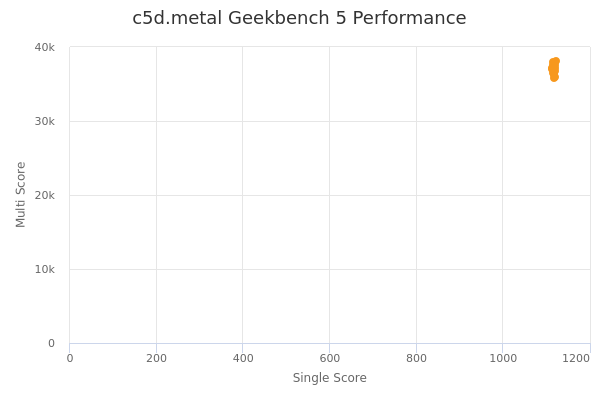
| Single | Multi | |
|---|---|---|
| Max | 1122 | 38053 |
| Average | 1118 | 37012 |
| Deviation | 2.52 | 594.08 |
| Min | 1113 | 35799 |
Sign up as Freemium to get more insight.