c5d.2xlarge by Amazon Web Services
Geekbench is a cross-platform processor benchmark with a scoring system that determines single-core and multi-core performance using loads simulating real-world scenarios. Geekbench 5 score is calculated with a reference score of 2500 representing the performance of the Intel Core i5-2520M @ 2.50 GHz. The software benchmark is available for Mac OS, Windows, Linux, Android and iOS platforms.
Specifications:
CPU
8
RAM
16.0 GB
Extra
1x
200 GB
NVMe SSD
Net
10000 Mbps
{
"configuration": {
"chart": {
"type": "scatter",
"polar": false,
"zoomType": "",
"options3d": {},
"height": null,
"width": null,
"margin": null,
"inverted": false,
"zooming": {}
},
"credits": {
"enabled": false
},
"title": {
"text": ""
},
"colorAxis": null,
"subtitle": {
"text": ""
},
"xAxis": {
"title": {
"text": [
"Single Score"
],
"useHTML": false,
"style": {
"color": "#666666"
}
},
"categories": null,
"lineWidth": 1,
"tickInterval": null,
"tickWidth": 1,
"tickLength": 10,
"tickPixelInterval": 100,
"plotLines": null,
"labels": {
"enabled": true,
"format": null,
"formatter": "",
"style": {
"color": "#666666",
"cursor": "default",
"fontSize": "11px"
},
"useHTML": false,
"step": 0
},
"plotBands": null,
"visible": true,
"floor": null,
"ceiling": null,
"type": "linear",
"min": 0,
"gridLineWidth": 1,
"gridLineColor": "#e6e6e6",
"minorTickInterval": null,
"minorTickWidth": 0,
"minTickInterval": null,
"startOnTick": true,
"endOnTick": true,
"tickmarkPlacement": 100,
"units": 100,
"minRange": 100
},
"yAxis": {
"title": {
"text": [
"Multi Score"
],
"useHTML": false,
"style": {
"color": "#666666"
}
},
"categories": null,
"plotLines": null,
"plotBands": null,
"lineWidth": null,
"tickInterval": null,
"tickLength": 10,
"floor": null,
"ceiling": null,
"gridLineInterpolation": null,
"gridLineWidth": 1,
"gridLineColor": "#e6e6e6",
"min": 0,
"max": null,
"minorTickInterval": null,
"minorTickWidth": 0,
"minTickInterval": null,
"startOnTick": true,
"endOnTick": true,
"minRange": null,
"type": "linear",
"tickmarkPlacement": null,
"labels": {
"enabled": true,
"formatter": null,
"style": {
"color": "#666666",
"cursor": "default",
"fontSize": "11px"
},
"useHTML": false
}
},
"zAxis": {
"title": {
"text": "Multi Score"
}
},
"plotOptions": {
"series": {
"dataLabels": {
"enabled": false,
"format": null,
"distance": 30,
"align": "center",
"inside": null,
"allowOverlap": false,
"style": {
"fontSize": "11px"
}
},
"showInLegend": null,
"turboThreshold": 0,
"stacking": "",
"groupPadding": 0.2,
"centerInCategory": false,
"findNearestPointBy": "x"
}
},
"navigator": {
"enabled": false
},
"scrollbar": {
"enabled": false
},
"rangeSelector": {
"enabled": false,
"inputEnabled": false
},
"legend": {
"enabled": null,
"maxHeight": null,
"align": "center",
"verticalAlign": "bottom",
"layout": "horizontal",
"width": null,
"margin": 12,
"reversed": false
},
"series": [
{
"name": "c5d.2xlarge by Amazon Web Services",
"color": "#f7981d",
"data": [
{
"x": 935.9856099923782,
"y": 4297.755814796973
},
{
"x": 891.5860798917736,
"y": 4216.77503653803
},
{
"x": 933.2885965564706,
"y": 4308.493818848136
},
{
"x": 889.2893038230288,
"y": 4221.3929065527755
},
{
"x": 936.3966861020621,
"y": 4297.916524595935
},
{
"x": 891.6059785246914,
"y": 4223.15120044753
},
{
"x": 936.9042129600721,
"y": 4299.672022636001
},
{
"x": 891.3908564994721,
"y": 4220.146009154616
},
{
"x": 935.6717930486894,
"y": 4298.855013209724
},
{
"x": 893.3390074362806,
"y": 4212.305344618619
},
{
"x": 936.6897392125927,
"y": 4298.3328817365555
},
{
"x": 893.9008593452758,
"y": 4219.935825260563
},
{
"x": 933.9584284212292,
"y": 4303.250646958597
},
{
"x": 890.6683273902995,
"y": 4214.034569618692
},
{
"x": 928.5018676054352,
"y": 4301.616295672336
},
{
"x": 887.5716592836209,
"y": 4219.662297041735
},
{
"x": 939.3877316885357,
"y": 4305.760648542822
},
{
"x": 893.968545404733,
"y": 4220.657218132953
},
{
"x": 934.7381487343091,
"y": 4304.772585273946
},
{
"x": 892.5922666510876,
"y": 4205.6775975261435
}
]
}
],
"drilldown": {},
"tooltip": {
"enabled": true,
"useHTML": false,
"format": null,
"headerFormat": "",
"pointFormat": "<span style=\"color:{series.color}\">Single</span>: <b>{point.x:.0f}</b><br><span style=\"color:{series.color}\">Multi</span>: <b>{point.y:.0f}</b>",
"footerFormat": "",
"shared": false,
"outside": false,
"valueDecimals": null,
"split": false
},
"annotations": null
},
"hc_type": "chart",
"id": "315062527914159604964050062618315272887"
}
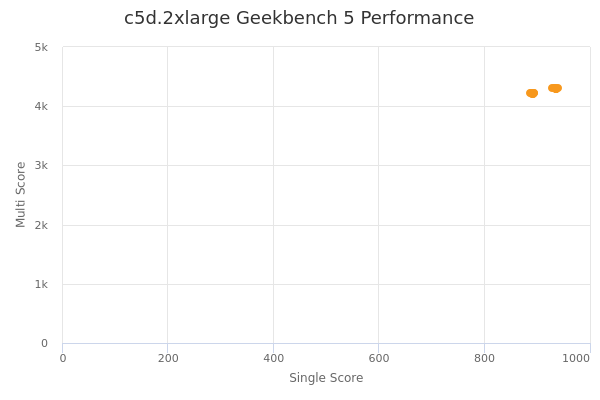
| Single | Multi | |
|---|---|---|
| Max | 939 | 4308 |
| Average | 913 | 4260 |
| Deviation | 21.91 | 42.36 |
| Min | 888 | 4206 |
Sign up as Freemium to get more insight.