s3.medium.2 by T-Systems Open Telekom Cloud
Geekbench is a cross-platform processor benchmark with a scoring system that determines single-core and multi-core performance using loads simulating real-world scenarios. Geekbench 5 score is calculated with a reference score of 2500 representing the performance of the Intel Core i5-2520M @ 2.50 GHz. The software benchmark is available for Mac OS, Windows, Linux, Android and iOS platforms.
Specifications:
CPU
1
RAM
2.0 GB
{
"configuration": {
"chart": {
"type": "scatter",
"polar": false,
"zoomType": "",
"options3d": {},
"height": null,
"width": null,
"margin": null,
"inverted": false,
"zooming": {}
},
"credits": {
"enabled": false
},
"title": {
"text": ""
},
"colorAxis": null,
"subtitle": {
"text": ""
},
"xAxis": {
"title": {
"text": [
"Single Score"
],
"useHTML": false,
"style": {
"color": "#666666"
}
},
"categories": null,
"lineWidth": 1,
"tickInterval": null,
"tickWidth": 1,
"tickLength": 10,
"tickPixelInterval": 100,
"plotLines": null,
"labels": {
"enabled": true,
"format": null,
"formatter": "",
"style": {
"color": "#666666",
"cursor": "default",
"fontSize": "11px"
},
"useHTML": false,
"step": 0
},
"plotBands": null,
"visible": true,
"floor": null,
"ceiling": null,
"type": "linear",
"min": 0,
"gridLineWidth": 1,
"gridLineColor": "#e6e6e6",
"minorTickInterval": null,
"minorTickWidth": 0,
"minTickInterval": null,
"startOnTick": true,
"endOnTick": true,
"tickmarkPlacement": 100,
"units": 100,
"minRange": 100
},
"yAxis": {
"title": {
"text": [
"Multi Score"
],
"useHTML": false,
"style": {
"color": "#666666"
}
},
"categories": null,
"plotLines": null,
"plotBands": null,
"lineWidth": null,
"tickInterval": null,
"tickLength": 10,
"floor": null,
"ceiling": null,
"gridLineInterpolation": null,
"gridLineWidth": 1,
"gridLineColor": "#e6e6e6",
"min": 0,
"max": null,
"minorTickInterval": null,
"minorTickWidth": 0,
"minTickInterval": null,
"startOnTick": true,
"endOnTick": true,
"minRange": null,
"type": "linear",
"tickmarkPlacement": null,
"labels": {
"enabled": true,
"formatter": null,
"style": {
"color": "#666666",
"cursor": "default",
"fontSize": "11px"
},
"useHTML": false
}
},
"zAxis": {
"title": {
"text": "Multi Score"
}
},
"plotOptions": {
"series": {
"dataLabels": {
"enabled": false,
"format": null,
"distance": 30,
"align": "center",
"inside": null,
"allowOverlap": false,
"style": {
"fontSize": "11px"
}
},
"showInLegend": null,
"turboThreshold": 0,
"stacking": "",
"groupPadding": 0.2,
"centerInCategory": false,
"findNearestPointBy": "x"
}
},
"navigator": {
"enabled": false
},
"scrollbar": {
"enabled": false
},
"rangeSelector": {
"enabled": false,
"inputEnabled": false
},
"legend": {
"enabled": null,
"maxHeight": null,
"align": "center",
"verticalAlign": "bottom",
"layout": "horizontal",
"width": null,
"margin": 12,
"reversed": false
},
"series": [
{
"name": "s3.medium.2 by T-Systems Open Telekom Cloud",
"color": "#d1006c",
"data": [
{
"x": 915.1893786991393,
"y": 902.3189361051272
},
{
"x": 898.5904431607855,
"y": 888.4496171442677
},
{
"x": 905.5284980754201,
"y": 916.4352972907217
},
{
"x": 890.96215812898,
"y": 890.6645351664474
},
{
"x": 913.9686403109085,
"y": 913.764655306089
},
{
"x": 888.7102254958199,
"y": 891.9915825721057
},
{
"x": 913.5686908412366,
"y": 907.310706584037
},
{
"x": 896.1745033764059,
"y": 898.3643460386735
},
{
"x": 906.5705563342088,
"y": 897.6684911965824
},
{
"x": 922.4249821671376,
"y": 910.7689538056349
},
{
"x": 904.2103368490775,
"y": 904.3779257101849
},
{
"x": 898.1445361315141,
"y": 887.3440632125614
},
{
"x": 902.4717941245915,
"y": 911.4408268030734
},
{
"x": 900.0426037637526,
"y": 897.1818825217065
},
{
"x": 907.4041451432871,
"y": 894.8787586937067
},
{
"x": 898.2927943868049,
"y": 894.0058064417185
},
{
"x": 908.4409068766302,
"y": 912.401865665555
},
{
"x": 900.5220303830235,
"y": 899.0128355091947
},
{
"x": 912.2046664796819,
"y": 908.4772244565954
},
{
"x": 903.8757310099435,
"y": 901.1059786915315
}
]
}
],
"drilldown": {},
"tooltip": {
"enabled": true,
"useHTML": false,
"format": null,
"headerFormat": "",
"pointFormat": "<span style=\"color:{series.color}\">Single</span>: <b>{point.x:.0f}</b><br><span style=\"color:{series.color}\">Multi</span>: <b>{point.y:.0f}</b>",
"footerFormat": "",
"shared": false,
"outside": false,
"valueDecimals": null,
"split": false
},
"annotations": null
},
"hc_type": "chart",
"id": "338418092184068927709777481995263601638"
}
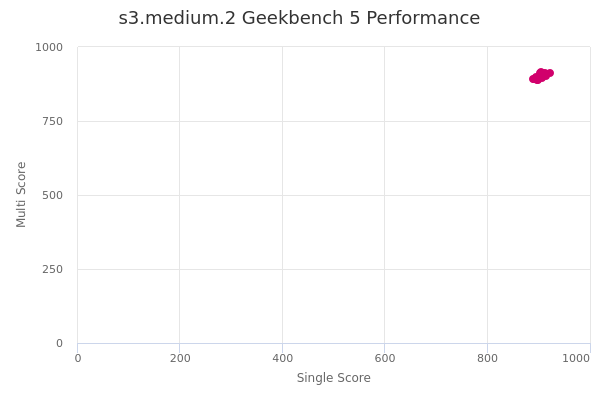
| Single | Multi | |
|---|---|---|
| Max | 922 | 916 |
| Average | 904 | 901 |
| Deviation | 8.22 | 8.65 |
| Min | 889 | 887 |
Sign up as Freemium to get more insight.
- In same series
- s3.medium.1
- s3.medium.2
- s3.medium.4
- s3.medium.8
- s3.large.1
- s3.large.2
- s3.large.4
- s3.large.8
- s3.xlarge.1
- s3.xlarge.2
- s3.xlarge.4
- s3.xlarge.8
- s3.2xlarge.1
- s3.2xlarge.2
- s3.2xlarge.4
- s3.2xlarge.8
- s3.4xlarge.1
- s3.4xlarge.2
- s3.4xlarge.4
- s3.4xlarge.8
- s3.8xlarge.1
- s3.8xlarge.2
- s3.8xlarge.4
- s3.8xlarge.8