s3.8xlarge.1 by T-Systems Open Telekom Cloud
Geekbench is a cross-platform processor benchmark with a scoring system that determines single-core and multi-core performance using loads simulating real-world scenarios. Geekbench 5 score is calculated with a reference score of 2500 representing the performance of the Intel Core i5-2520M @ 2.50 GHz. The software benchmark is available for Mac OS, Windows, Linux, Android and iOS platforms.
Specifications:
CPU
32
RAM
32.0 GB
{
"configuration": {
"chart": {
"type": "scatter",
"polar": false,
"zoomType": "",
"options3d": {},
"height": null,
"width": null,
"margin": null,
"inverted": false,
"zooming": {}
},
"credits": {
"enabled": false
},
"title": {
"text": ""
},
"colorAxis": null,
"subtitle": {
"text": ""
},
"xAxis": {
"title": {
"text": [
"Single Score"
],
"useHTML": false,
"style": {
"color": "#666666"
}
},
"categories": null,
"lineWidth": 1,
"tickInterval": null,
"tickWidth": 1,
"tickLength": 10,
"tickPixelInterval": 100,
"plotLines": null,
"labels": {
"enabled": true,
"format": null,
"formatter": "",
"style": {
"color": "#666666",
"cursor": "default",
"fontSize": "11px"
},
"useHTML": false,
"step": 0
},
"plotBands": null,
"visible": true,
"floor": null,
"ceiling": null,
"type": "linear",
"min": 0,
"gridLineWidth": 1,
"gridLineColor": "#e6e6e6",
"minorTickInterval": null,
"minorTickWidth": 0,
"minTickInterval": null,
"startOnTick": true,
"endOnTick": true,
"tickmarkPlacement": 100,
"units": 100,
"minRange": 100
},
"yAxis": {
"title": {
"text": [
"Multi Score"
],
"useHTML": false,
"style": {
"color": "#666666"
}
},
"categories": null,
"plotLines": null,
"plotBands": null,
"lineWidth": null,
"tickInterval": null,
"tickLength": 10,
"floor": null,
"ceiling": null,
"gridLineInterpolation": null,
"gridLineWidth": 1,
"gridLineColor": "#e6e6e6",
"min": 0,
"max": null,
"minorTickInterval": null,
"minorTickWidth": 0,
"minTickInterval": null,
"startOnTick": true,
"endOnTick": true,
"minRange": null,
"type": "linear",
"tickmarkPlacement": null,
"labels": {
"enabled": true,
"formatter": null,
"style": {
"color": "#666666",
"cursor": "default",
"fontSize": "11px"
},
"useHTML": false
}
},
"zAxis": {
"title": {
"text": "Multi Score"
}
},
"plotOptions": {
"series": {
"dataLabels": {
"enabled": false,
"format": null,
"distance": 30,
"align": "center",
"inside": null,
"allowOverlap": false,
"style": {
"fontSize": "11px"
}
},
"showInLegend": null,
"turboThreshold": 0,
"stacking": "",
"groupPadding": 0.2,
"centerInCategory": false,
"findNearestPointBy": "x"
}
},
"navigator": {
"enabled": false
},
"scrollbar": {
"enabled": false
},
"rangeSelector": {
"enabled": false,
"inputEnabled": false
},
"legend": {
"enabled": null,
"maxHeight": null,
"align": "center",
"verticalAlign": "bottom",
"layout": "horizontal",
"width": null,
"margin": 12,
"reversed": false
},
"series": [
{
"name": "s3.8xlarge.1 by T-Systems Open Telekom Cloud",
"color": "#d1006c",
"data": [
{
"x": 945.1965439173738,
"y": 22691.030332862712
},
{
"x": 921.5847552388223,
"y": 22313.55977356083
},
{
"x": 941.7121187200332,
"y": 22543.239657737013
},
{
"x": 918.8107284264051,
"y": 22291.511622721173
},
{
"x": 927.9021475050625,
"y": 23159.297793043246
},
{
"x": 913.6996222727619,
"y": 22802.952137333526
},
{
"x": 938.5120530698953,
"y": 21766.75124329661
},
{
"x": 940.9589356028836,
"y": 22377.35911341969
},
{
"x": 939.5546332738838,
"y": 22527.767391429785
},
{
"x": 939.2091048351192,
"y": 22149.789751645887
},
{
"x": 922.0211401163106,
"y": 22776.606455649147
},
{
"x": 918.9750338870658,
"y": 21890.628136134677
},
{
"x": 938.9959094289875,
"y": 21770.396390556903
},
{
"x": 933.6793712621356,
"y": 19663.484864971437
},
{
"x": 940.3614556751756,
"y": 22606.017236178654
},
{
"x": 926.456734638753,
"y": 20377.99609468109
},
{
"x": 927.3387486577949,
"y": 22394.72272131138
},
{
"x": 932.3458133013021,
"y": 21340.55099967195
},
{
"x": 937.348873278092,
"y": 22514.927282776687
},
{
"x": 915.2970492548836,
"y": 20835.47766097782
}
]
}
],
"drilldown": {},
"tooltip": {
"enabled": true,
"useHTML": false,
"format": null,
"headerFormat": "",
"pointFormat": "<span style=\"color:{series.color}\">Single</span>: <b>{point.x:.0f}</b><br><span style=\"color:{series.color}\">Multi</span>: <b>{point.y:.0f}</b>",
"footerFormat": "",
"shared": false,
"outside": false,
"valueDecimals": null,
"split": false
},
"annotations": null
},
"hc_type": "chart",
"id": "154740005849149459528985995213729444994"
}
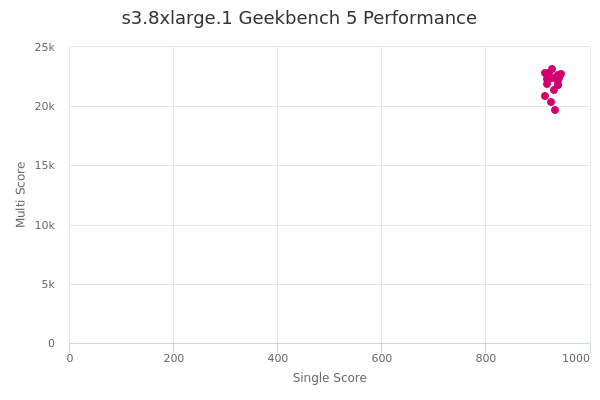
| Single | Multi | |
|---|---|---|
| Max | 945 | 23159 |
| Average | 931 | 22040 |
| Deviation | 9.66 | 858.72 |
| Min | 914 | 19663 |
Sign up as Freemium to get more insight.
- In same series
- s3.medium.1
- s3.medium.2
- s3.medium.4
- s3.medium.8
- s3.large.1
- s3.large.2
- s3.large.4
- s3.large.8
- s3.xlarge.1
- s3.xlarge.2
- s3.xlarge.4
- s3.xlarge.8
- s3.2xlarge.1
- s3.2xlarge.2
- s3.2xlarge.4
- s3.2xlarge.8
- s3.4xlarge.1
- s3.4xlarge.2
- s3.4xlarge.4
- s3.4xlarge.8
- s3.8xlarge.1
- s3.8xlarge.2
- s3.8xlarge.4
- s3.8xlarge.8