s3.2xlarge.1 by T-Systems Open Telekom Cloud
Geekbench is a cross-platform processor benchmark with a scoring system that determines single-core and multi-core performance using loads simulating real-world scenarios. Geekbench 5 score is calculated with a reference score of 2500 representing the performance of the Intel Core i5-2520M @ 2.50 GHz. The software benchmark is available for Mac OS, Windows, Linux, Android and iOS platforms.
Specifications:
CPU
8
RAM
8.0 GB
{
"configuration": {
"chart": {
"type": "scatter",
"polar": false,
"zoomType": "",
"options3d": {},
"height": null,
"width": null,
"margin": null,
"inverted": false,
"zooming": {}
},
"credits": {
"enabled": false
},
"title": {
"text": ""
},
"colorAxis": null,
"subtitle": {
"text": ""
},
"xAxis": {
"title": {
"text": [
"Single Score"
],
"useHTML": false,
"style": {
"color": "#666666"
}
},
"categories": null,
"lineWidth": 1,
"tickInterval": null,
"tickWidth": 1,
"tickLength": 10,
"tickPixelInterval": 100,
"plotLines": null,
"labels": {
"enabled": true,
"format": null,
"formatter": "",
"style": {
"color": "#666666",
"cursor": "default",
"fontSize": "11px"
},
"useHTML": false,
"step": 0
},
"plotBands": null,
"visible": true,
"floor": null,
"ceiling": null,
"type": "linear",
"min": 0,
"gridLineWidth": 1,
"gridLineColor": "#e6e6e6",
"minorTickInterval": null,
"minorTickWidth": 0,
"minTickInterval": null,
"startOnTick": true,
"endOnTick": true,
"tickmarkPlacement": 100,
"units": 100,
"minRange": 100
},
"yAxis": {
"title": {
"text": [
"Multi Score"
],
"useHTML": false,
"style": {
"color": "#666666"
}
},
"categories": null,
"plotLines": null,
"plotBands": null,
"lineWidth": null,
"tickInterval": null,
"tickLength": 10,
"floor": null,
"ceiling": null,
"gridLineInterpolation": null,
"gridLineWidth": 1,
"gridLineColor": "#e6e6e6",
"min": 0,
"max": null,
"minorTickInterval": null,
"minorTickWidth": 0,
"minTickInterval": null,
"startOnTick": true,
"endOnTick": true,
"minRange": null,
"type": "linear",
"tickmarkPlacement": null,
"labels": {
"enabled": true,
"formatter": null,
"style": {
"color": "#666666",
"cursor": "default",
"fontSize": "11px"
},
"useHTML": false
}
},
"zAxis": {
"title": {
"text": "Multi Score"
}
},
"plotOptions": {
"series": {
"dataLabels": {
"enabled": false,
"format": null,
"distance": 30,
"align": "center",
"inside": null,
"allowOverlap": false,
"style": {
"fontSize": "11px"
}
},
"showInLegend": null,
"turboThreshold": 0,
"stacking": "",
"groupPadding": 0.2,
"centerInCategory": false,
"findNearestPointBy": "x"
}
},
"navigator": {
"enabled": false
},
"scrollbar": {
"enabled": false
},
"rangeSelector": {
"enabled": false,
"inputEnabled": false
},
"legend": {
"enabled": null,
"maxHeight": null,
"align": "center",
"verticalAlign": "bottom",
"layout": "horizontal",
"width": null,
"margin": 12,
"reversed": false
},
"series": [
{
"name": "s3.2xlarge.1 by T-Systems Open Telekom Cloud",
"color": "#d1006c",
"data": [
{
"x": 938.7294717860256,
"y": 7014.303884109522
},
{
"x": 925.8583919467891,
"y": 6965.586829327361
},
{
"x": 932.824882582488,
"y": 7029.926754213731
},
{
"x": 936.3975778354495,
"y": 6968.108456355772
},
{
"x": 934.8285582827316,
"y": 7093.829340564467
},
{
"x": 934.3128113721687,
"y": 7027.702885937924
},
{
"x": 940.3678929953933,
"y": 6980.05778506838
},
{
"x": 935.3825178544237,
"y": 6836.586873510425
},
{
"x": 944.1348728298758,
"y": 7096.8347483656
},
{
"x": 927.1401476823671,
"y": 7000.777180360528
},
{
"x": 940.4706469584117,
"y": 7029.690980610487
},
{
"x": 934.5435815894164,
"y": 6839.683450513129
},
{
"x": 921.1262768510019,
"y": 6925.17761586143
},
{
"x": 933.7016437102025,
"y": 7000.111581138295
},
{
"x": 937.3518752378841,
"y": 7029.719380244642
},
{
"x": 919.5067988000333,
"y": 7079.851250357644
},
{
"x": 940.5311212922455,
"y": 7150.519701453457
},
{
"x": 940.287134918153,
"y": 7013.3155981591635
},
{
"x": 928.8159872196131,
"y": 7057.840789832902
},
{
"x": 927.4016172929319,
"y": 6940.49251238387
},
{
"x": 957.187214058699,
"y": 7048.0456744632775
},
{
"x": 932.8304577843699,
"y": 7057.600334133447
},
{
"x": 933.5326448726539,
"y": 7090.751727058392
},
{
"x": 932.0387071469972,
"y": 7067.322396256111
},
{
"x": 925.5801259582381,
"y": 6800.960642717004
},
{
"x": 935.2714200021537,
"y": 7019.454567732455
},
{
"x": 933.5418624732806,
"y": 7083.530313015743
},
{
"x": 933.7109847907566,
"y": 7009.181538413478
},
{
"x": 937.1288120883326,
"y": 6959.8255404374695
},
{
"x": 938.6632928376587,
"y": 7029.063679090292
},
{
"x": 940.2770866819003,
"y": 7094.168096436507
},
{
"x": 944.2154397134707,
"y": 6999.62519212243
},
{
"x": 935.7093764524459,
"y": 6967.698341626651
},
{
"x": 936.6172480292291,
"y": 6948.291434428362
},
{
"x": 932.9060094828383,
"y": 6975.6861761361015
},
{
"x": 941.0532482244919,
"y": 7031.914512019679
},
{
"x": 928.3223259556257,
"y": 7007.695204598788
},
{
"x": 920.3039584401015,
"y": 7030.221609707967
},
{
"x": 932.9584052508417,
"y": 7050.146351516996
},
{
"x": 932.173837068919,
"y": 6970.762675567143
}
]
}
],
"drilldown": {},
"tooltip": {
"enabled": true,
"useHTML": false,
"format": null,
"headerFormat": "",
"pointFormat": "<span style=\"color:{series.color}\">Single</span>: <b>{point.x:.0f}</b><br><span style=\"color:{series.color}\">Multi</span>: <b>{point.y:.0f}</b>",
"footerFormat": "",
"shared": false,
"outside": false,
"valueDecimals": null,
"split": false
},
"annotations": null
},
"hc_type": "chart",
"id": "290006894971094309902929551677295122141"
}
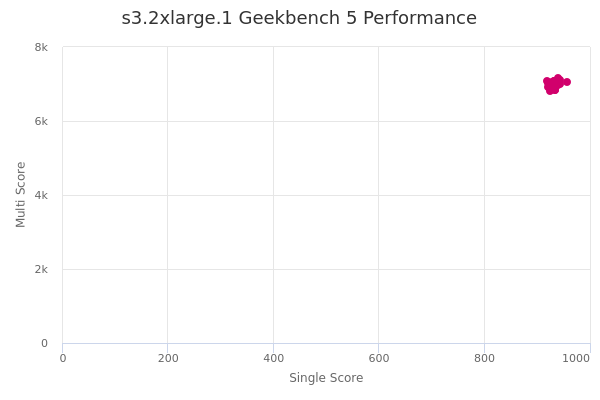
| Single | Multi | |
|---|---|---|
| Max | 957 | 7151 |
| Average | 934 | 7008 |
| Deviation | 6.96 | 71.13 |
| Min | 920 | 6801 |
Sign up as Freemium to get more insight.
- In same series
- s3.medium.1
- s3.medium.2
- s3.medium.4
- s3.medium.8
- s3.large.1
- s3.large.2
- s3.large.4
- s3.large.8
- s3.xlarge.1
- s3.xlarge.2
- s3.xlarge.4
- s3.xlarge.8
- s3.2xlarge.1
- s3.2xlarge.2
- s3.2xlarge.4
- s3.2xlarge.8
- s3.4xlarge.1
- s3.4xlarge.2
- s3.4xlarge.4
- s3.4xlarge.8
- s3.8xlarge.1
- s3.8xlarge.2
- s3.8xlarge.4
- s3.8xlarge.8