s3.8xlarge.2 by T-Systems Open Telekom Cloud
Geekbench is a cross-platform processor benchmark with a scoring system that determines single-core and multi-core performance using loads simulating real-world scenarios. Geekbench 5 score is calculated with a reference score of 2500 representing the performance of the Intel Core i5-2520M @ 2.50 GHz. The software benchmark is available for Mac OS, Windows, Linux, Android and iOS platforms.
Specifications:
CPU
32
RAM
64.0 GB
{
"configuration": {
"chart": {
"type": "scatter",
"polar": false,
"zoomType": "",
"options3d": {},
"height": null,
"width": null,
"margin": null,
"inverted": false,
"zooming": {}
},
"credits": {
"enabled": false
},
"title": {
"text": ""
},
"colorAxis": null,
"subtitle": {
"text": ""
},
"xAxis": {
"title": {
"text": [
"Single Score"
],
"useHTML": false,
"style": {
"color": "#666666"
}
},
"categories": null,
"lineWidth": 1,
"tickInterval": null,
"tickWidth": 1,
"tickLength": 10,
"tickPixelInterval": 100,
"plotLines": null,
"labels": {
"enabled": true,
"format": null,
"formatter": "",
"style": {
"color": "#666666",
"cursor": "default",
"fontSize": "11px"
},
"useHTML": false,
"step": 0
},
"plotBands": null,
"visible": true,
"floor": null,
"ceiling": null,
"type": "linear",
"min": 0,
"gridLineWidth": 1,
"gridLineColor": "#e6e6e6",
"minorTickInterval": null,
"minorTickWidth": 0,
"minTickInterval": null,
"startOnTick": true,
"endOnTick": true,
"tickmarkPlacement": 100,
"units": 100,
"minRange": 100
},
"yAxis": {
"title": {
"text": [
"Multi Score"
],
"useHTML": false,
"style": {
"color": "#666666"
}
},
"categories": null,
"plotLines": null,
"plotBands": null,
"lineWidth": null,
"tickInterval": null,
"tickLength": 10,
"floor": null,
"ceiling": null,
"gridLineInterpolation": null,
"gridLineWidth": 1,
"gridLineColor": "#e6e6e6",
"min": 0,
"max": null,
"minorTickInterval": null,
"minorTickWidth": 0,
"minTickInterval": null,
"startOnTick": true,
"endOnTick": true,
"minRange": null,
"type": "linear",
"tickmarkPlacement": null,
"labels": {
"enabled": true,
"formatter": null,
"style": {
"color": "#666666",
"cursor": "default",
"fontSize": "11px"
},
"useHTML": false
}
},
"zAxis": {
"title": {
"text": "Multi Score"
}
},
"plotOptions": {
"series": {
"dataLabels": {
"enabled": false,
"format": null,
"distance": 30,
"align": "center",
"inside": null,
"allowOverlap": false,
"style": {
"fontSize": "11px"
}
},
"showInLegend": null,
"turboThreshold": 0,
"stacking": "",
"groupPadding": 0.2,
"centerInCategory": false,
"findNearestPointBy": "x"
}
},
"navigator": {
"enabled": false
},
"scrollbar": {
"enabled": false
},
"rangeSelector": {
"enabled": false,
"inputEnabled": false
},
"legend": {
"enabled": null,
"maxHeight": null,
"align": "center",
"verticalAlign": "bottom",
"layout": "horizontal",
"width": null,
"margin": 12,
"reversed": false
},
"series": [
{
"name": "s3.8xlarge.2 by T-Systems Open Telekom Cloud",
"color": "#d1006c",
"data": [
{
"x": 923.1171557739061,
"y": 22092.584282685835
},
{
"x": 924.9491195574103,
"y": 21637.47157141843
},
{
"x": 914.5913135212431,
"y": 22435.784941964615
},
{
"x": 930.7981265716902,
"y": 22344.873338571288
},
{
"x": 925.2457499430585,
"y": 22783.85303748274
},
{
"x": 922.9575253861581,
"y": 22453.09882727841
},
{
"x": 916.2223694131006,
"y": 20789.760511552522
},
{
"x": 919.5394416264769,
"y": 21759.54668862866
},
{
"x": 924.0169054790005,
"y": 22008.385768258162
},
{
"x": 909.6163387449121,
"y": 21654.03726264932
},
{
"x": 925.0687126604497,
"y": 22541.69686654849
},
{
"x": 921.2855246937588,
"y": 21146.816607000444
},
{
"x": 924.0569908441189,
"y": 22345.022381343366
},
{
"x": 926.3318009282331,
"y": 21858.638517425075
},
{
"x": 923.5561277864215,
"y": 22652.239041421355
},
{
"x": 909.8591105000719,
"y": 21188.461509792716
},
{
"x": 925.4020148660385,
"y": 22477.52955190163
},
{
"x": 919.3967063275386,
"y": 22291.191449596678
},
{
"x": 924.501299432349,
"y": 22414.96709511258
},
{
"x": 890.5833222208303,
"y": 21950.91889216459
},
{
"x": 921.2028529777378,
"y": 22866.262178731184
},
{
"x": 922.4614957063966,
"y": 22314.16296086033
},
{
"x": 938.0852478151437,
"y": 21915.121592658714
},
{
"x": 929.3066430214262,
"y": 20360.419504609607
},
{
"x": 927.7127244036474,
"y": 21574.440522091354
},
{
"x": 921.8005700182241,
"y": 22379.744510034652
},
{
"x": 940.8807709484461,
"y": 21761.244379454776
},
{
"x": 936.6351843006335,
"y": 20931.157294625275
},
{
"x": 928.8065056346012,
"y": 22587.554798374877
},
{
"x": 916.300119914264,
"y": 22185.790876596475
},
{
"x": 940.2642866211842,
"y": 22399.913878821477
},
{
"x": 884.1058585866956,
"y": 21763.31989198883
},
{
"x": 918.2546682182777,
"y": 22804.58522486131
},
{
"x": 914.82972046944,
"y": 21964.122073364306
},
{
"x": 944.4599645328027,
"y": 22236.555280670975
},
{
"x": 903.1971778807967,
"y": 20609.234755570596
},
{
"x": 933.2945380021022,
"y": 22555.759225757232
},
{
"x": 926.3957539541418,
"y": 22186.15483830702
},
{
"x": 937.2662387076617,
"y": 22841.609017479757
},
{
"x": 912.3761562686253,
"y": 20738.197206017347
}
]
}
],
"drilldown": {},
"tooltip": {
"enabled": true,
"useHTML": false,
"format": null,
"headerFormat": "",
"pointFormat": "<span style=\"color:{series.color}\">Single</span>: <b>{point.x:.0f}</b><br><span style=\"color:{series.color}\">Multi</span>: <b>{point.y:.0f}</b>",
"footerFormat": "",
"shared": false,
"outside": false,
"valueDecimals": null,
"split": false
},
"annotations": null
},
"hc_type": "chart",
"id": "277418274114945823507978752728117142727"
}
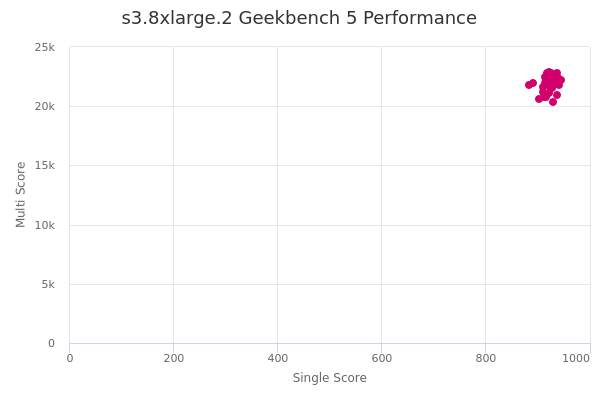
| Single | Multi | |
|---|---|---|
| Max | 944 | 22866 |
| Average | 922 | 21995 |
| Deviation | 11.93 | 644.00 |
| Min | 884 | 20360 |
Sign up as Freemium to get more insight.
- In same series
- s3.medium.1
- s3.medium.2
- s3.medium.4
- s3.medium.8
- s3.large.1
- s3.large.2
- s3.large.4
- s3.large.8
- s3.xlarge.1
- s3.xlarge.2
- s3.xlarge.4
- s3.xlarge.8
- s3.2xlarge.1
- s3.2xlarge.2
- s3.2xlarge.4
- s3.2xlarge.8
- s3.4xlarge.1
- s3.4xlarge.2
- s3.4xlarge.4
- s3.4xlarge.8
- s3.8xlarge.1
- s3.8xlarge.2
- s3.8xlarge.4
- s3.8xlarge.8