s3.medium.1 by T-Systems Open Telekom Cloud
Geekbench is a cross-platform processor benchmark with a scoring system that determines single-core and multi-core performance using loads simulating real-world scenarios. Geekbench 5 score is calculated with a reference score of 2500 representing the performance of the Intel Core i5-2520M @ 2.50 GHz. The software benchmark is available for Mac OS, Windows, Linux, Android and iOS platforms.
Specifications:
CPU
1
RAM
1.0 GB
{
"configuration": {
"chart": {
"type": "scatter",
"polar": false,
"zoomType": "",
"options3d": {},
"height": null,
"width": null,
"margin": null,
"inverted": false,
"zooming": {}
},
"credits": {
"enabled": false
},
"title": {
"text": ""
},
"colorAxis": null,
"subtitle": {
"text": ""
},
"xAxis": {
"title": {
"text": [
"Single Score"
],
"useHTML": false,
"style": {
"color": "#666666"
}
},
"categories": null,
"lineWidth": 1,
"tickInterval": null,
"tickWidth": 1,
"tickLength": 10,
"tickPixelInterval": 100,
"plotLines": null,
"labels": {
"enabled": true,
"format": null,
"formatter": "",
"style": {
"color": "#666666",
"cursor": "default",
"fontSize": "11px"
},
"useHTML": false,
"step": 0
},
"plotBands": null,
"visible": true,
"floor": null,
"ceiling": null,
"type": "linear",
"min": 0,
"gridLineWidth": 1,
"gridLineColor": "#e6e6e6",
"minorTickInterval": null,
"minorTickWidth": 0,
"minTickInterval": null,
"startOnTick": true,
"endOnTick": true,
"tickmarkPlacement": 100,
"units": 100,
"minRange": 100
},
"yAxis": {
"title": {
"text": [
"Multi Score"
],
"useHTML": false,
"style": {
"color": "#666666"
}
},
"categories": null,
"plotLines": null,
"plotBands": null,
"lineWidth": null,
"tickInterval": null,
"tickLength": 10,
"floor": null,
"ceiling": null,
"gridLineInterpolation": null,
"gridLineWidth": 1,
"gridLineColor": "#e6e6e6",
"min": 0,
"max": null,
"minorTickInterval": null,
"minorTickWidth": 0,
"minTickInterval": null,
"startOnTick": true,
"endOnTick": true,
"minRange": null,
"type": "linear",
"tickmarkPlacement": null,
"labels": {
"enabled": true,
"formatter": null,
"style": {
"color": "#666666",
"cursor": "default",
"fontSize": "11px"
},
"useHTML": false
}
},
"zAxis": {
"title": {
"text": "Multi Score"
}
},
"plotOptions": {
"series": {
"dataLabels": {
"enabled": false,
"format": null,
"distance": 30,
"align": "center",
"inside": null,
"allowOverlap": false,
"style": {
"fontSize": "11px"
}
},
"showInLegend": null,
"turboThreshold": 0,
"stacking": "",
"groupPadding": 0.2,
"centerInCategory": false,
"findNearestPointBy": "x"
}
},
"navigator": {
"enabled": false
},
"scrollbar": {
"enabled": false
},
"rangeSelector": {
"enabled": false,
"inputEnabled": false
},
"legend": {
"enabled": null,
"maxHeight": null,
"align": "center",
"verticalAlign": "bottom",
"layout": "horizontal",
"width": null,
"margin": 12,
"reversed": false
},
"series": [
{
"name": "s3.medium.1 by T-Systems Open Telekom Cloud",
"color": "#d1006c",
"data": [
{
"x": 895.3216750513092,
"y": 895.7014968296241
},
{
"x": 878.128366205724,
"y": 882.2563578002494
},
{
"x": 898.4344470662586,
"y": 898.0317403303783
},
{
"x": 878.8780455941719,
"y": 882.5279584265925
},
{
"x": 897.6582031650194,
"y": 888.8202074633207
},
{
"x": 876.7630947509593,
"y": 866.8838245259574
},
{
"x": 900.1590975406145,
"y": 897.026791315286
},
{
"x": 888.5840906440138,
"y": 879.4029244645645
},
{
"x": 864.2670231839263,
"y": 875.7147909325654
},
{
"x": 895.9748256040475,
"y": 899.8232229538402
},
{
"x": 893.3978238715335,
"y": 897.2870605347335
},
{
"x": 883.0161484846727,
"y": 872.2189348345819
},
{
"x": 906.6901529914574,
"y": 890.0159017300148
},
{
"x": 881.9533730452656,
"y": 879.1006223988854
},
{
"x": 903.2564374008039,
"y": 903.7098152207509
},
{
"x": 881.7990916847282,
"y": 883.2016782943506
},
{
"x": 894.6008591387131,
"y": 903.4448995510595
},
{
"x": 893.0677376312206,
"y": 885.5396263144139
},
{
"x": 904.3242928721128,
"y": 900.4586440236095
},
{
"x": 887.5637496296669,
"y": 883.5282997169033
}
]
}
],
"drilldown": {},
"tooltip": {
"enabled": true,
"useHTML": false,
"format": null,
"headerFormat": "",
"pointFormat": "<span style=\"color:{series.color}\">Single</span>: <b>{point.x:.0f}</b><br><span style=\"color:{series.color}\">Multi</span>: <b>{point.y:.0f}</b>",
"footerFormat": "",
"shared": false,
"outside": false,
"valueDecimals": null,
"split": false
},
"annotations": null
},
"hc_type": "chart",
"id": "12402933121733216355133545953942669285"
}
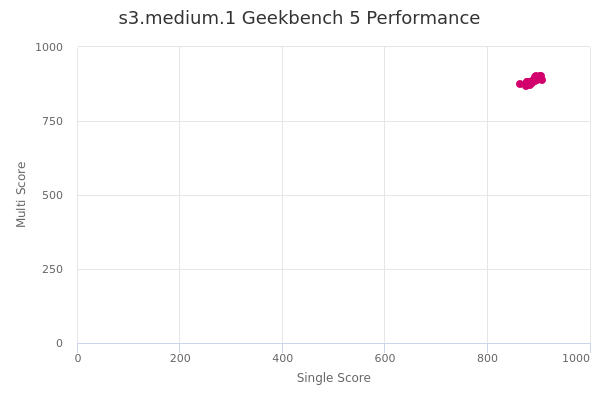
| Single | Multi | |
|---|---|---|
| Max | 907 | 904 |
| Average | 890 | 888 |
| Deviation | 10.70 | 10.54 |
| Min | 864 | 867 |
Sign up as Freemium to get more insight.
- In same series
- s3.medium.1
- s3.medium.2
- s3.medium.4
- s3.medium.8
- s3.large.1
- s3.large.2
- s3.large.4
- s3.large.8
- s3.xlarge.1
- s3.xlarge.2
- s3.xlarge.4
- s3.xlarge.8
- s3.2xlarge.1
- s3.2xlarge.2
- s3.2xlarge.4
- s3.2xlarge.8
- s3.4xlarge.1
- s3.4xlarge.2
- s3.4xlarge.4
- s3.4xlarge.8
- s3.8xlarge.1
- s3.8xlarge.2
- s3.8xlarge.4
- s3.8xlarge.8