s3.xlarge.8 by T-Systems Open Telekom Cloud
Geekbench is a cross-platform processor benchmark with a scoring system that determines single-core and multi-core performance using loads simulating real-world scenarios. Geekbench 5 score is calculated with a reference score of 2500 representing the performance of the Intel Core i5-2520M @ 2.50 GHz. The software benchmark is available for Mac OS, Windows, Linux, Android and iOS platforms.
Specifications:
CPU
4
RAM
32.0 GB
{
"configuration": {
"chart": {
"type": "scatter",
"polar": false,
"zoomType": "",
"options3d": {},
"height": null,
"width": null,
"margin": null,
"inverted": false,
"zooming": {}
},
"credits": {
"enabled": false
},
"title": {
"text": ""
},
"colorAxis": null,
"subtitle": {
"text": ""
},
"xAxis": {
"title": {
"text": [
"Single Score"
],
"useHTML": false,
"style": {
"color": "#666666"
}
},
"categories": null,
"lineWidth": 1,
"tickInterval": null,
"tickWidth": 1,
"tickLength": 10,
"tickPixelInterval": 100,
"plotLines": null,
"labels": {
"enabled": true,
"format": null,
"formatter": "",
"style": {
"color": "#666666",
"cursor": "default",
"fontSize": "11px"
},
"useHTML": false,
"step": 0
},
"plotBands": null,
"visible": true,
"floor": null,
"ceiling": null,
"type": "linear",
"min": 0,
"gridLineWidth": 1,
"gridLineColor": "#e6e6e6",
"minorTickInterval": null,
"minorTickWidth": 0,
"minTickInterval": null,
"startOnTick": true,
"endOnTick": true,
"tickmarkPlacement": 100,
"units": 100,
"minRange": 100
},
"yAxis": {
"title": {
"text": [
"Multi Score"
],
"useHTML": false,
"style": {
"color": "#666666"
}
},
"categories": null,
"plotLines": null,
"plotBands": null,
"lineWidth": null,
"tickInterval": null,
"tickLength": 10,
"floor": null,
"ceiling": null,
"gridLineInterpolation": null,
"gridLineWidth": 1,
"gridLineColor": "#e6e6e6",
"min": 0,
"max": null,
"minorTickInterval": null,
"minorTickWidth": 0,
"minTickInterval": null,
"startOnTick": true,
"endOnTick": true,
"minRange": null,
"type": "linear",
"tickmarkPlacement": null,
"labels": {
"enabled": true,
"formatter": null,
"style": {
"color": "#666666",
"cursor": "default",
"fontSize": "11px"
},
"useHTML": false
}
},
"zAxis": {
"title": {
"text": "Multi Score"
}
},
"plotOptions": {
"series": {
"dataLabels": {
"enabled": false,
"format": null,
"distance": 30,
"align": "center",
"inside": null,
"allowOverlap": false,
"style": {
"fontSize": "11px"
}
},
"showInLegend": null,
"turboThreshold": 0,
"stacking": "",
"groupPadding": 0.2,
"centerInCategory": false,
"findNearestPointBy": "x"
}
},
"navigator": {
"enabled": false
},
"scrollbar": {
"enabled": false
},
"rangeSelector": {
"enabled": false,
"inputEnabled": false
},
"legend": {
"enabled": null,
"maxHeight": null,
"align": "center",
"verticalAlign": "bottom",
"layout": "horizontal",
"width": null,
"margin": 12,
"reversed": false
},
"series": [
{
"name": "s3.xlarge.8 by T-Systems Open Telekom Cloud",
"color": "#d1006c",
"data": [
{
"x": 918.3386934549007,
"y": 3442.5055339537853
},
{
"x": 904.713060882342,
"y": 3441.2655769592025
},
{
"x": 929.3093639807316,
"y": 3566.1773536120886
},
{
"x": 898.6189081949385,
"y": 3504.037866861775
},
{
"x": 922.6726860345627,
"y": 3573.6970490328117
},
{
"x": 903.9945191466104,
"y": 3494.4748645881664
},
{
"x": 921.446333353718,
"y": 3516.6697347584472
},
{
"x": 898.4851748013969,
"y": 3487.3627744160817
},
{
"x": 928.7426083411983,
"y": 3561.117178937502
},
{
"x": 891.7184052152805,
"y": 3458.4314617776213
},
{
"x": 927.52698267492,
"y": 3550.3127897210643
},
{
"x": 894.6791294116224,
"y": 3501.104065414115
},
{
"x": 931.1437383975791,
"y": 3534.939414239233
},
{
"x": 905.8127236566957,
"y": 3545.4935234919085
},
{
"x": 921.6465756321795,
"y": 3549.035875548251
},
{
"x": 909.0824198788482,
"y": 3519.0161468877086
},
{
"x": 919.7918943429104,
"y": 3588.3712519547794
},
{
"x": 911.470337577678,
"y": 3585.55596993581
},
{
"x": 927.3921480998094,
"y": 3531.9720274188726
},
{
"x": 929.5360899429604,
"y": 3536.557219249694
}
]
}
],
"drilldown": {},
"tooltip": {
"enabled": true,
"useHTML": false,
"format": null,
"headerFormat": "",
"pointFormat": "<span style=\"color:{series.color}\">Single</span>: <b>{point.x:.0f}</b><br><span style=\"color:{series.color}\">Multi</span>: <b>{point.y:.0f}</b>",
"footerFormat": "",
"shared": false,
"outside": false,
"valueDecimals": null,
"split": false
},
"annotations": null
},
"hc_type": "chart",
"id": "274236744602792368492757012874140641178"
}
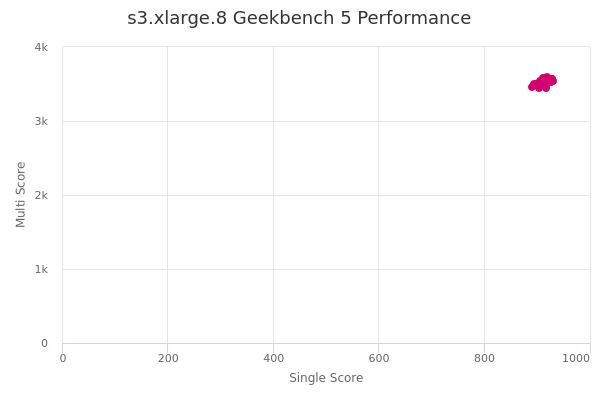
| Single | Multi | |
|---|---|---|
| Max | 931 | 3588 |
| Average | 915 | 3524 |
| Deviation | 12.67 | 42.82 |
| Min | 892 | 3441 |
Sign up as Freemium to get more insight.
- In same series
- s3.medium.1
- s3.medium.2
- s3.medium.4
- s3.medium.8
- s3.large.1
- s3.large.2
- s3.large.4
- s3.large.8
- s3.xlarge.1
- s3.xlarge.2
- s3.xlarge.4
- s3.xlarge.8
- s3.2xlarge.1
- s3.2xlarge.2
- s3.2xlarge.4
- s3.2xlarge.8
- s3.4xlarge.1
- s3.4xlarge.2
- s3.4xlarge.4
- s3.4xlarge.8
- s3.8xlarge.1
- s3.8xlarge.2
- s3.8xlarge.4
- s3.8xlarge.8