r5dn.2xlarge by Amazon Web Services
Geekbench is a cross-platform processor benchmark with a scoring system that determines single-core and multi-core performance using loads simulating real-world scenarios. Geekbench 5 score is calculated with a reference score of 2500 representing the performance of the Intel Core i5-2520M @ 2.50 GHz. The software benchmark is available for Mac OS, Windows, Linux, Android and iOS platforms.
Specifications:
CPU
8
RAM
64.0 GB
Extra
1x
300 GB
NVMe SSD
Net
25000 Mbps
{
"configuration": {
"chart": {
"type": "scatter",
"polar": false,
"zoomType": "",
"options3d": {},
"height": null,
"width": null,
"margin": null,
"inverted": false,
"zooming": {}
},
"credits": {
"enabled": false
},
"title": {
"text": ""
},
"colorAxis": null,
"subtitle": {
"text": ""
},
"xAxis": {
"title": {
"text": [
"Single Score"
],
"useHTML": false,
"style": {
"color": "#666666"
}
},
"categories": null,
"lineWidth": 1,
"tickInterval": null,
"tickWidth": 1,
"tickLength": 10,
"tickPixelInterval": 100,
"plotLines": null,
"labels": {
"enabled": true,
"format": null,
"formatter": "",
"style": {
"color": "#666666",
"cursor": "default",
"fontSize": "11px"
},
"useHTML": false,
"step": 0
},
"plotBands": null,
"visible": true,
"floor": null,
"ceiling": null,
"type": "linear",
"min": 0,
"gridLineWidth": 1,
"gridLineColor": "#e6e6e6",
"minorTickInterval": null,
"minorTickWidth": 0,
"minTickInterval": null,
"startOnTick": true,
"endOnTick": true,
"tickmarkPlacement": 100,
"units": 100,
"minRange": 100
},
"yAxis": {
"title": {
"text": [
"Multi Score"
],
"useHTML": false,
"style": {
"color": "#666666"
}
},
"categories": null,
"plotLines": null,
"plotBands": null,
"lineWidth": null,
"tickInterval": null,
"tickLength": 10,
"floor": null,
"ceiling": null,
"gridLineInterpolation": null,
"gridLineWidth": 1,
"gridLineColor": "#e6e6e6",
"min": 0,
"max": null,
"minorTickInterval": null,
"minorTickWidth": 0,
"minTickInterval": null,
"startOnTick": true,
"endOnTick": true,
"minRange": null,
"type": "linear",
"tickmarkPlacement": null,
"labels": {
"enabled": true,
"formatter": null,
"style": {
"color": "#666666",
"cursor": "default",
"fontSize": "11px"
},
"useHTML": false
}
},
"zAxis": {
"title": {
"text": "Multi Score"
}
},
"plotOptions": {
"series": {
"dataLabels": {
"enabled": false,
"format": null,
"distance": 30,
"align": "center",
"inside": null,
"allowOverlap": false,
"style": {
"fontSize": "11px"
}
},
"showInLegend": null,
"turboThreshold": 0,
"stacking": "",
"groupPadding": 0.2,
"centerInCategory": false,
"findNearestPointBy": "x"
}
},
"navigator": {
"enabled": false
},
"scrollbar": {
"enabled": false
},
"rangeSelector": {
"enabled": false,
"inputEnabled": false
},
"legend": {
"enabled": null,
"maxHeight": null,
"align": "center",
"verticalAlign": "bottom",
"layout": "horizontal",
"width": null,
"margin": 12,
"reversed": false
},
"series": [
{
"name": "r5dn.2xlarge by Amazon Web Services",
"color": "#f7981d",
"data": [
{
"x": 831.9320818999413,
"y": 3884.3651857992168
},
{
"x": 823.4895186600481,
"y": 3839.000855561646
},
{
"x": 817.7330221332697,
"y": 3855.1492258820076
},
{
"x": 830.4584967786343,
"y": 3787.94522810917
},
{
"x": 820.5489310086131,
"y": 3876.348877793149
},
{
"x": 810.1503947813883,
"y": 3820.6217778938417
},
{
"x": 853.7786703945094,
"y": 3860.3959313545133
},
{
"x": 815.694041746834,
"y": 3864.611066998662
},
{
"x": 824.3073943818276,
"y": 3871.494034332366
},
{
"x": 831.872848382304,
"y": 3836.4112383462016
},
{
"x": 833.632524352281,
"y": 3867.1573022709745
},
{
"x": 815.1034532683203,
"y": 3855.7157372814863
},
{
"x": 836.8237189261729,
"y": 3920.411656751716
},
{
"x": 836.8846504601104,
"y": 3891.9576542361283
},
{
"x": 841.6992651796354,
"y": 3867.1127487836425
},
{
"x": 837.7622160077781,
"y": 3890.9376983284383
},
{
"x": 839.4854997396317,
"y": 3876.591431216545
},
{
"x": 817.882505882145,
"y": 3875.323953433265
},
{
"x": 828.216723275054,
"y": 3855.172768377952
},
{
"x": 836.0608632919188,
"y": 3881.7517884330705
}
]
}
],
"drilldown": {},
"tooltip": {
"enabled": true,
"useHTML": false,
"format": null,
"headerFormat": "",
"pointFormat": "<span style=\"color:{series.color}\">Single</span>: <b>{point.x:.0f}</b><br><span style=\"color:{series.color}\">Multi</span>: <b>{point.y:.0f}</b>",
"footerFormat": "",
"shared": false,
"outside": false,
"valueDecimals": null,
"split": false
},
"annotations": null
},
"hc_type": "chart",
"id": "285053972083850375812131099203228108247"
}
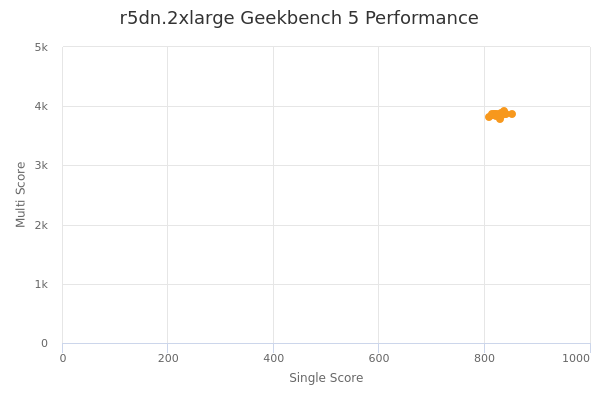
| Single | Multi | |
|---|---|---|
| Max | 854 | 3920 |
| Average | 829 | 3864 |
| Deviation | 10.67 | 27.59 |
| Min | 810 | 3788 |
Sign up as Freemium to get more insight.