r5dn.xlarge by Amazon Web Services
Geekbench is a cross-platform processor benchmark with a scoring system that determines single-core and multi-core performance using loads simulating real-world scenarios. Geekbench 5 score is calculated with a reference score of 2500 representing the performance of the Intel Core i5-2520M @ 2.50 GHz. The software benchmark is available for Mac OS, Windows, Linux, Android and iOS platforms.
Specifications:
CPU
4
RAM
32.0 GB
Extra
1x
150 GB
NVMe SSD
Net
25000 Mbps
{
"configuration": {
"chart": {
"type": "scatter",
"polar": false,
"zoomType": "",
"options3d": {},
"height": null,
"width": null,
"margin": null,
"inverted": false,
"zooming": {}
},
"credits": {
"enabled": false
},
"title": {
"text": ""
},
"colorAxis": null,
"subtitle": {
"text": ""
},
"xAxis": {
"title": {
"text": [
"Single Score"
],
"useHTML": false,
"style": {
"color": "#666666"
}
},
"categories": null,
"lineWidth": 1,
"tickInterval": null,
"tickWidth": 1,
"tickLength": 10,
"tickPixelInterval": 100,
"plotLines": null,
"labels": {
"enabled": true,
"format": null,
"formatter": "",
"style": {
"color": "#666666",
"cursor": "default",
"fontSize": "11px"
},
"useHTML": false,
"step": 0
},
"plotBands": null,
"visible": true,
"floor": null,
"ceiling": null,
"type": "linear",
"min": 0,
"gridLineWidth": 1,
"gridLineColor": "#e6e6e6",
"minorTickInterval": null,
"minorTickWidth": 0,
"minTickInterval": null,
"startOnTick": true,
"endOnTick": true,
"tickmarkPlacement": 100,
"units": 100,
"minRange": 100
},
"yAxis": {
"title": {
"text": [
"Multi Score"
],
"useHTML": false,
"style": {
"color": "#666666"
}
},
"categories": null,
"plotLines": null,
"plotBands": null,
"lineWidth": null,
"tickInterval": null,
"tickLength": 10,
"floor": null,
"ceiling": null,
"gridLineInterpolation": null,
"gridLineWidth": 1,
"gridLineColor": "#e6e6e6",
"min": 0,
"max": null,
"minorTickInterval": null,
"minorTickWidth": 0,
"minTickInterval": null,
"startOnTick": true,
"endOnTick": true,
"minRange": null,
"type": "linear",
"tickmarkPlacement": null,
"labels": {
"enabled": true,
"formatter": null,
"style": {
"color": "#666666",
"cursor": "default",
"fontSize": "11px"
},
"useHTML": false
}
},
"zAxis": {
"title": {
"text": "Multi Score"
}
},
"plotOptions": {
"series": {
"dataLabels": {
"enabled": false,
"format": null,
"distance": 30,
"align": "center",
"inside": null,
"allowOverlap": false,
"style": {
"fontSize": "11px"
}
},
"showInLegend": null,
"turboThreshold": 0,
"stacking": "",
"groupPadding": 0.2,
"centerInCategory": false,
"findNearestPointBy": "x"
}
},
"navigator": {
"enabled": false
},
"scrollbar": {
"enabled": false
},
"rangeSelector": {
"enabled": false,
"inputEnabled": false
},
"legend": {
"enabled": null,
"maxHeight": null,
"align": "center",
"verticalAlign": "bottom",
"layout": "horizontal",
"width": null,
"margin": 12,
"reversed": false
},
"series": [
{
"name": "r5dn.xlarge by Amazon Web Services",
"color": "#f7981d",
"data": [
{
"x": 897.6084022131868,
"y": 2101.712846126866
},
{
"x": 882.2963728926771,
"y": 2073.2627886281653
},
{
"x": 900.6845120256489,
"y": 2103.835631896794
},
{
"x": 879.1697367931542,
"y": 2060.455654242672
},
{
"x": 898.6322685804774,
"y": 2098.0308243296495
},
{
"x": 877.3708151280975,
"y": 2065.3007837783025
},
{
"x": 901.2994210976522,
"y": 2101.910280234262
},
{
"x": 879.3974044753047,
"y": 2060.8870343262597
},
{
"x": 901.5996922330228,
"y": 2103.0200505468847
},
{
"x": 876.1954502355313,
"y": 2072.982659001641
},
{
"x": 897.0703427414564,
"y": 2101.7475468011535
},
{
"x": 883.2570949671683,
"y": 2065.245249462355
},
{
"x": 899.9664385992033,
"y": 2104.328211127154
},
{
"x": 882.248292203689,
"y": 2073.583145082448
},
{
"x": 898.0835185636167,
"y": 2095.7062503368115
},
{
"x": 881.3206565119046,
"y": 2067.438923563379
},
{
"x": 901.6269114253191,
"y": 2103.585684165696
},
{
"x": 878.9909307089475,
"y": 2073.4704598921267
},
{
"x": 900.7692571396954,
"y": 2101.084444820642
},
{
"x": 882.4541966495451,
"y": 2066.4036578983223
},
{
"x": 898.7170309640496,
"y": 2090.7451060994917
},
{
"x": 893.5451096444131,
"y": 2083.7283963823656
},
{
"x": 899.8878825448056,
"y": 2097.7696121599256
},
{
"x": 894.8371679951495,
"y": 2089.463410572866
},
{
"x": 905.0514093027311,
"y": 2099.5547091207786
},
{
"x": 905.1157705067794,
"y": 2086.817895801907
},
{
"x": 904.9219993037696,
"y": 2095.3970159730025
},
{
"x": 899.6635093837144,
"y": 2089.498136928178
},
{
"x": 906.4429292172281,
"y": 2097.1550686303744
},
{
"x": 906.2322176076295,
"y": 2093.404698282055
},
{
"x": 905.7797850819509,
"y": 2103.0403545143804
},
{
"x": 903.4405063497691,
"y": 2091.337977677419
},
{
"x": 905.4111051304121,
"y": 2096.6993659174996
},
{
"x": 901.0319926979239,
"y": 2089.3220472021735
},
{
"x": 899.9573644249559,
"y": 2092.4540160810493
},
{
"x": 904.3154528566852,
"y": 2083.5948407204105
},
{
"x": 905.2260870138311,
"y": 2091.315479034017
},
{
"x": 905.7845293981298,
"y": 2089.634049382276
},
{
"x": 904.8089565081348,
"y": 2099.101900156367
},
{
"x": 901.3782369536997,
"y": 2086.0863775551034
}
]
}
],
"drilldown": {},
"tooltip": {
"enabled": true,
"useHTML": false,
"format": null,
"headerFormat": "",
"pointFormat": "<span style=\"color:{series.color}\">Single</span>: <b>{point.x:.0f}</b><br><span style=\"color:{series.color}\">Multi</span>: <b>{point.y:.0f}</b>",
"footerFormat": "",
"shared": false,
"outside": false,
"valueDecimals": null,
"split": false
},
"annotations": null
},
"hc_type": "chart",
"id": "54543487665236261005313236671837878975"
}
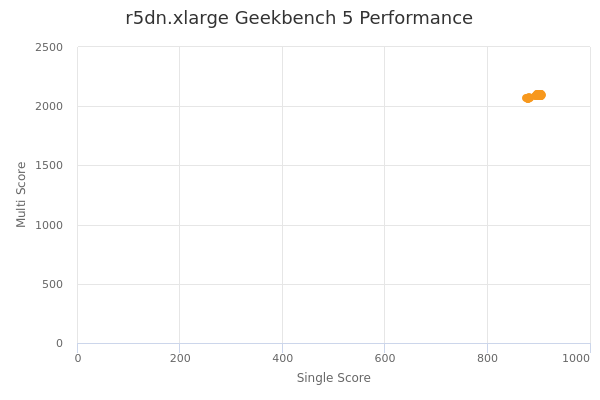
| Single | Multi | |
|---|---|---|
| Max | 906 | 2104 |
| Average | 896 | 2089 |
| Deviation | 9.78 | 13.30 |
| Min | 876 | 2060 |
Sign up as Freemium to get more insight.