r5dn.4xlarge by Amazon Web Services
Geekbench is a cross-platform processor benchmark with a scoring system that determines single-core and multi-core performance using loads simulating real-world scenarios. Geekbench 5 score is calculated with a reference score of 2500 representing the performance of the Intel Core i5-2520M @ 2.50 GHz. The software benchmark is available for Mac OS, Windows, Linux, Android and iOS platforms.
Specifications:
CPU
16
RAM
128.0 GB
Extra
2x
300 GB
NVMe SSD
Net
25000 Mbps
{
"configuration": {
"chart": {
"type": "scatter",
"polar": false,
"zoomType": "",
"options3d": {},
"height": null,
"width": null,
"margin": null,
"inverted": false,
"zooming": {}
},
"credits": {
"enabled": false
},
"title": {
"text": ""
},
"colorAxis": null,
"subtitle": {
"text": ""
},
"xAxis": {
"title": {
"text": [
"Single Score"
],
"useHTML": false,
"style": {
"color": "#666666"
}
},
"categories": null,
"lineWidth": 1,
"tickInterval": null,
"tickWidth": 1,
"tickLength": 10,
"tickPixelInterval": 100,
"plotLines": null,
"labels": {
"enabled": true,
"format": null,
"formatter": "",
"style": {
"color": "#666666",
"cursor": "default",
"fontSize": "11px"
},
"useHTML": false,
"step": 0
},
"plotBands": null,
"visible": true,
"floor": null,
"ceiling": null,
"type": "linear",
"min": 0,
"gridLineWidth": 1,
"gridLineColor": "#e6e6e6",
"minorTickInterval": null,
"minorTickWidth": 0,
"minTickInterval": null,
"startOnTick": true,
"endOnTick": true,
"tickmarkPlacement": 100,
"units": 100,
"minRange": 100
},
"yAxis": {
"title": {
"text": [
"Multi Score"
],
"useHTML": false,
"style": {
"color": "#666666"
}
},
"categories": null,
"plotLines": null,
"plotBands": null,
"lineWidth": null,
"tickInterval": null,
"tickLength": 10,
"floor": null,
"ceiling": null,
"gridLineInterpolation": null,
"gridLineWidth": 1,
"gridLineColor": "#e6e6e6",
"min": 0,
"max": null,
"minorTickInterval": null,
"minorTickWidth": 0,
"minTickInterval": null,
"startOnTick": true,
"endOnTick": true,
"minRange": null,
"type": "linear",
"tickmarkPlacement": null,
"labels": {
"enabled": true,
"formatter": null,
"style": {
"color": "#666666",
"cursor": "default",
"fontSize": "11px"
},
"useHTML": false
}
},
"zAxis": {
"title": {
"text": "Multi Score"
}
},
"plotOptions": {
"series": {
"dataLabels": {
"enabled": false,
"format": null,
"distance": 30,
"align": "center",
"inside": null,
"allowOverlap": false,
"style": {
"fontSize": "11px"
}
},
"showInLegend": null,
"turboThreshold": 0,
"stacking": "",
"groupPadding": 0.2,
"centerInCategory": false,
"findNearestPointBy": "x"
}
},
"navigator": {
"enabled": false
},
"scrollbar": {
"enabled": false
},
"rangeSelector": {
"enabled": false,
"inputEnabled": false
},
"legend": {
"enabled": null,
"maxHeight": null,
"align": "center",
"verticalAlign": "bottom",
"layout": "horizontal",
"width": null,
"margin": 12,
"reversed": false
},
"series": [
{
"name": "r5dn.4xlarge by Amazon Web Services",
"color": "#f7981d",
"data": [
{
"x": 879.2039001437327,
"y": 7680.878288439459
},
{
"x": 857.7990590652047,
"y": 7623.362884972961
},
{
"x": 883.5864380705688,
"y": 7673.759621335222
},
{
"x": 864.3458128228913,
"y": 7645.436486247636
},
{
"x": 870.8917584542735,
"y": 7674.388320268193
},
{
"x": 859.3328390104186,
"y": 7625.942491808302
},
{
"x": 872.507861010529,
"y": 7668.877364572306
},
{
"x": 858.8990079969549,
"y": 7605.112905336467
},
{
"x": 880.4654614890335,
"y": 7687.382268500265
},
{
"x": 857.9541012275356,
"y": 7580.255158375102
},
{
"x": 873.8219271847188,
"y": 7695.510918975911
},
{
"x": 858.6336186370686,
"y": 7625.662689079558
},
{
"x": 884.2728627437841,
"y": 7656.434566740895
},
{
"x": 859.5020383531605,
"y": 7619.92832140184
},
{
"x": 878.0800934580249,
"y": 7681.915567607277
},
{
"x": 857.5504635335271,
"y": 7628.325775003754
},
{
"x": 879.5469914802748,
"y": 7690.179529979285
},
{
"x": 855.6303250675243,
"y": 7560.898601220717
},
{
"x": 870.514661648159,
"y": 7669.216767823806
},
{
"x": 845.1814899810348,
"y": 7563.197218953888
}
]
}
],
"drilldown": {},
"tooltip": {
"enabled": true,
"useHTML": false,
"format": null,
"headerFormat": "",
"pointFormat": "<span style=\"color:{series.color}\">Single</span>: <b>{point.x:.0f}</b><br><span style=\"color:{series.color}\">Multi</span>: <b>{point.y:.0f}</b>",
"footerFormat": "",
"shared": false,
"outside": false,
"valueDecimals": null,
"split": false
},
"annotations": null
},
"hc_type": "chart",
"id": "229409824630525161224034857935646875130"
}
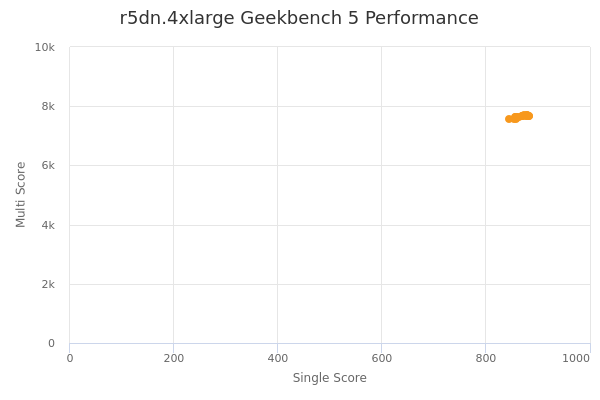
| Single | Multi | |
|---|---|---|
| Max | 884 | 7696 |
| Average | 867 | 7643 |
| Deviation | 10.96 | 40.98 |
| Min | 845 | 7561 |
Sign up as Freemium to get more insight.