r5dn.8xlarge by Amazon Web Services
Geekbench is a cross-platform processor benchmark with a scoring system that determines single-core and multi-core performance using loads simulating real-world scenarios. Geekbench 5 score is calculated with a reference score of 2500 representing the performance of the Intel Core i5-2520M @ 2.50 GHz. The software benchmark is available for Mac OS, Windows, Linux, Android and iOS platforms.
Specifications:
CPU
32
RAM
256.0 GB
Extra
2x
600 GB
NVMe SSD
Net
25000 Mbps
{
"configuration": {
"chart": {
"type": "scatter",
"polar": false,
"zoomType": "",
"options3d": {},
"height": null,
"width": null,
"margin": null,
"inverted": false,
"zooming": {}
},
"credits": {
"enabled": false
},
"title": {
"text": ""
},
"colorAxis": null,
"subtitle": {
"text": ""
},
"xAxis": {
"title": {
"text": [
"Single Score"
],
"useHTML": false,
"style": {
"color": "#666666"
}
},
"categories": null,
"lineWidth": 1,
"tickInterval": null,
"tickWidth": 1,
"tickLength": 10,
"tickPixelInterval": 100,
"plotLines": null,
"labels": {
"enabled": true,
"format": null,
"formatter": "",
"style": {
"color": "#666666",
"cursor": "default",
"fontSize": "11px"
},
"useHTML": false,
"step": 0
},
"plotBands": null,
"visible": true,
"floor": null,
"ceiling": null,
"type": "linear",
"min": 0,
"gridLineWidth": 1,
"gridLineColor": "#e6e6e6",
"minorTickInterval": null,
"minorTickWidth": 0,
"minTickInterval": null,
"startOnTick": true,
"endOnTick": true,
"tickmarkPlacement": 100,
"units": 100,
"minRange": 100
},
"yAxis": {
"title": {
"text": [
"Multi Score"
],
"useHTML": false,
"style": {
"color": "#666666"
}
},
"categories": null,
"plotLines": null,
"plotBands": null,
"lineWidth": null,
"tickInterval": null,
"tickLength": 10,
"floor": null,
"ceiling": null,
"gridLineInterpolation": null,
"gridLineWidth": 1,
"gridLineColor": "#e6e6e6",
"min": 0,
"max": null,
"minorTickInterval": null,
"minorTickWidth": 0,
"minTickInterval": null,
"startOnTick": true,
"endOnTick": true,
"minRange": null,
"type": "linear",
"tickmarkPlacement": null,
"labels": {
"enabled": true,
"formatter": null,
"style": {
"color": "#666666",
"cursor": "default",
"fontSize": "11px"
},
"useHTML": false
}
},
"zAxis": {
"title": {
"text": "Multi Score"
}
},
"plotOptions": {
"series": {
"dataLabels": {
"enabled": false,
"format": null,
"distance": 30,
"align": "center",
"inside": null,
"allowOverlap": false,
"style": {
"fontSize": "11px"
}
},
"showInLegend": null,
"turboThreshold": 0,
"stacking": "",
"groupPadding": 0.2,
"centerInCategory": false,
"findNearestPointBy": "x"
}
},
"navigator": {
"enabled": false
},
"scrollbar": {
"enabled": false
},
"rangeSelector": {
"enabled": false,
"inputEnabled": false
},
"legend": {
"enabled": null,
"maxHeight": null,
"align": "center",
"verticalAlign": "bottom",
"layout": "horizontal",
"width": null,
"margin": 12,
"reversed": false
},
"series": [
{
"name": "r5dn.8xlarge by Amazon Web Services",
"color": "#f7981d",
"data": [
{
"x": 921.3536033114744,
"y": 14739.572079646468
},
{
"x": 918.2783380444371,
"y": 14662.840574853006
},
{
"x": 918.8133272396485,
"y": 14727.216990153483
},
{
"x": 917.9332307008372,
"y": 14755.518256890598
},
{
"x": 918.2403043222313,
"y": 14722.621677395844
},
{
"x": 916.710602252946,
"y": 14719.175645281484
},
{
"x": 918.1403729993972,
"y": 14750.652042411111
},
{
"x": 916.2844223338857,
"y": 14699.917367578895
},
{
"x": 915.9719966505291,
"y": 14727.995110578973
},
{
"x": 919.6987362666762,
"y": 14704.123167598129
},
{
"x": 916.8409926843332,
"y": 14720.443226360625
},
{
"x": 919.6838598806531,
"y": 14731.365435160329
},
{
"x": 911.0525033242866,
"y": 14743.946043472944
},
{
"x": 916.3040248615298,
"y": 14560.318049823363
},
{
"x": 916.1842023039044,
"y": 14740.103576515303
},
{
"x": 916.6482405225137,
"y": 14635.177848899071
},
{
"x": 917.916619154586,
"y": 14725.418131904851
},
{
"x": 913.4236084187353,
"y": 14752.77393309388
},
{
"x": 916.4965132394606,
"y": 14737.483601038635
},
{
"x": 915.8025956052443,
"y": 14750.523369236658
}
]
}
],
"drilldown": {},
"tooltip": {
"enabled": true,
"useHTML": false,
"format": null,
"headerFormat": "",
"pointFormat": "<span style=\"color:{series.color}\">Single</span>: <b>{point.x:.0f}</b><br><span style=\"color:{series.color}\">Multi</span>: <b>{point.y:.0f}</b>",
"footerFormat": "",
"shared": false,
"outside": false,
"valueDecimals": null,
"split": false
},
"annotations": null
},
"hc_type": "chart",
"id": "275843715285932002727067593653527374289"
}
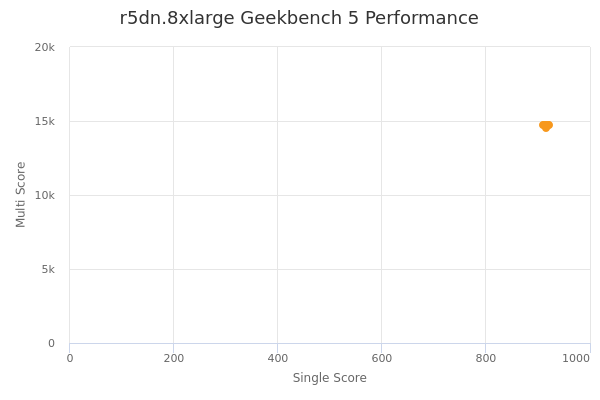
| Single | Multi | |
|---|---|---|
| Max | 921 | 14756 |
| Average | 917 | 14715 |
| Deviation | 2.19 | 46.01 |
| Min | 911 | 14560 |
Sign up as Freemium to get more insight.