c6a.8xlarge by Amazon Web Services
Geekbench is a cross-platform processor benchmark with a scoring system that determines single-core and multi-core performance using loads simulating real-world scenarios. Geekbench 5 score is calculated with a reference score of 2500 representing the performance of the Intel Core i5-2520M @ 2.50 GHz. The software benchmark is available for Mac OS, Windows, Linux, Android and iOS platforms.
Specifications:
CPU
32
RAM
64.0 GB
Net
12500 Mbps
{
"configuration": {
"chart": {
"type": "scatter",
"polar": false,
"zoomType": "",
"options3d": {},
"height": null,
"width": null,
"margin": null,
"inverted": false,
"zooming": {}
},
"credits": {
"enabled": false
},
"title": {
"text": ""
},
"colorAxis": null,
"subtitle": {
"text": ""
},
"xAxis": {
"title": {
"text": [
"Single Score"
],
"useHTML": false,
"style": {
"color": "#666666"
}
},
"categories": null,
"lineWidth": 1,
"tickInterval": null,
"tickWidth": 1,
"tickLength": 10,
"tickPixelInterval": 100,
"plotLines": null,
"labels": {
"enabled": true,
"format": null,
"formatter": "",
"style": {
"color": "#666666",
"cursor": "default",
"fontSize": "11px"
},
"useHTML": false,
"step": 0
},
"plotBands": null,
"visible": true,
"floor": null,
"ceiling": null,
"type": "linear",
"min": 0,
"gridLineWidth": 1,
"gridLineColor": "#e6e6e6",
"minorTickInterval": null,
"minorTickWidth": 0,
"minTickInterval": null,
"startOnTick": true,
"endOnTick": true,
"tickmarkPlacement": 100,
"units": 100,
"minRange": 100
},
"yAxis": {
"title": {
"text": [
"Multi Score"
],
"useHTML": false,
"style": {
"color": "#666666"
}
},
"categories": null,
"plotLines": null,
"plotBands": null,
"lineWidth": null,
"tickInterval": null,
"tickLength": 10,
"floor": null,
"ceiling": null,
"gridLineInterpolation": null,
"gridLineWidth": 1,
"gridLineColor": "#e6e6e6",
"min": 0,
"max": null,
"minorTickInterval": null,
"minorTickWidth": 0,
"minTickInterval": null,
"startOnTick": true,
"endOnTick": true,
"minRange": null,
"type": "linear",
"tickmarkPlacement": null,
"labels": {
"enabled": true,
"formatter": null,
"style": {
"color": "#666666",
"cursor": "default",
"fontSize": "11px"
},
"useHTML": false
}
},
"zAxis": {
"title": {
"text": "Multi Score"
}
},
"plotOptions": {
"series": {
"dataLabels": {
"enabled": false,
"format": null,
"distance": 30,
"align": "center",
"inside": null,
"allowOverlap": false,
"style": {
"fontSize": "11px"
}
},
"showInLegend": null,
"turboThreshold": 0,
"stacking": "",
"groupPadding": 0.2,
"centerInCategory": false,
"findNearestPointBy": "x"
}
},
"navigator": {
"enabled": false
},
"scrollbar": {
"enabled": false
},
"rangeSelector": {
"enabled": false,
"inputEnabled": false
},
"legend": {
"enabled": null,
"maxHeight": null,
"align": "center",
"verticalAlign": "bottom",
"layout": "horizontal",
"width": null,
"margin": 12,
"reversed": false
},
"series": [
{
"name": "c6a.8xlarge by Amazon Web Services",
"color": "#f7981d",
"data": [
{
"x": 1324.2590954989337,
"y": 18086.63496922601
},
{
"x": 1327.4666444247102,
"y": 17657.06008462967
},
{
"x": 1321.5794381710584,
"y": 18512.653300115042
},
{
"x": 1331.3432029143082,
"y": 17457.19262548578
},
{
"x": 1322.2805027537895,
"y": 17737.131810338607
},
{
"x": 1325.1611796406871,
"y": 17947.431149238586
},
{
"x": 1324.772765533289,
"y": 18010.7277957112
},
{
"x": 1326.605940874797,
"y": 17848.21691906474
},
{
"x": 1324.968149854653,
"y": 17931.821135758764
},
{
"x": 1328.547336856232,
"y": 18121.950352705142
},
{
"x": 1324.5600084041737,
"y": 18278.87167498674
},
{
"x": 1321.9391484557968,
"y": 18018.65597291497
},
{
"x": 1322.5350348619174,
"y": 18089.48551288477
},
{
"x": 1319.7974202622026,
"y": 18124.712402659137
},
{
"x": 1327.2650476451763,
"y": 18466.558211352538
},
{
"x": 1322.8479984860755,
"y": 17914.073172829434
},
{
"x": 1321.3765238666524,
"y": 18331.42878791236
},
{
"x": 1327.9742416255372,
"y": 18330.40443236025
},
{
"x": 1323.5948777977094,
"y": 18223.278609938385
},
{
"x": 1324.450594870148,
"y": 18315.01154802213
}
]
}
],
"drilldown": {},
"tooltip": {
"enabled": true,
"useHTML": false,
"format": null,
"headerFormat": "",
"pointFormat": "<span style=\"color:{series.color}\">Single</span>: <b>{point.x:.0f}</b><br><span style=\"color:{series.color}\">Multi</span>: <b>{point.y:.0f}</b>",
"footerFormat": "",
"shared": false,
"outside": false,
"valueDecimals": null,
"split": false
},
"annotations": null
},
"hc_type": "chart",
"id": "21373736366690423824525572696141341732"
}
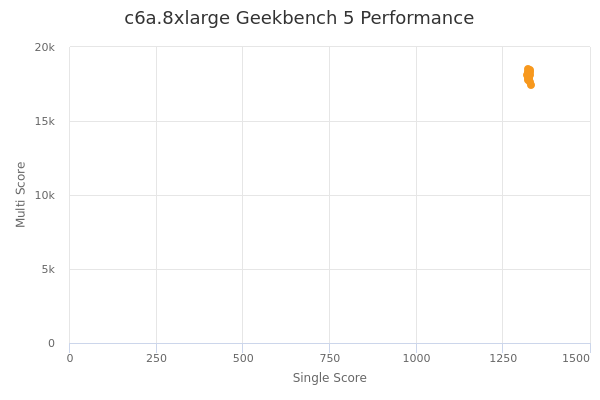
| Single | Multi | |
|---|---|---|
| Max | 1331 | 18513 |
| Average | 1325 | 18070 |
| Deviation | 2.79 | 263.96 |
| Min | 1320 | 17457 |
Sign up as Freemium to get more insight.