c6a.16xlarge by Amazon Web Services
Geekbench is a cross-platform processor benchmark with a scoring system that determines single-core and multi-core performance using loads simulating real-world scenarios. Geekbench 5 score is calculated with a reference score of 2500 representing the performance of the Intel Core i5-2520M @ 2.50 GHz. The software benchmark is available for Mac OS, Windows, Linux, Android and iOS platforms.
Specifications:
CPU
64
RAM
128.0 GB
Net
25000 Mbps
{
"configuration": {
"chart": {
"type": "scatter",
"polar": false,
"zoomType": "",
"options3d": {},
"height": null,
"width": null,
"margin": null,
"inverted": false,
"zooming": {}
},
"credits": {
"enabled": false
},
"title": {
"text": ""
},
"colorAxis": null,
"subtitle": {
"text": ""
},
"xAxis": {
"title": {
"text": [
"Single Score"
],
"useHTML": false,
"style": {
"color": "#666666"
}
},
"categories": null,
"lineWidth": 1,
"tickInterval": null,
"tickWidth": 1,
"tickLength": 10,
"tickPixelInterval": 100,
"plotLines": null,
"labels": {
"enabled": true,
"format": null,
"formatter": "",
"style": {
"color": "#666666",
"cursor": "default",
"fontSize": "11px"
},
"useHTML": false,
"step": 0
},
"plotBands": null,
"visible": true,
"floor": null,
"ceiling": null,
"type": "linear",
"min": 0,
"gridLineWidth": 1,
"gridLineColor": "#e6e6e6",
"minorTickInterval": null,
"minorTickWidth": 0,
"minTickInterval": null,
"startOnTick": true,
"endOnTick": true,
"tickmarkPlacement": 100,
"units": 100,
"minRange": 100
},
"yAxis": {
"title": {
"text": [
"Multi Score"
],
"useHTML": false,
"style": {
"color": "#666666"
}
},
"categories": null,
"plotLines": null,
"plotBands": null,
"lineWidth": null,
"tickInterval": null,
"tickLength": 10,
"floor": null,
"ceiling": null,
"gridLineInterpolation": null,
"gridLineWidth": 1,
"gridLineColor": "#e6e6e6",
"min": 0,
"max": null,
"minorTickInterval": null,
"minorTickWidth": 0,
"minTickInterval": null,
"startOnTick": true,
"endOnTick": true,
"minRange": null,
"type": "linear",
"tickmarkPlacement": null,
"labels": {
"enabled": true,
"formatter": null,
"style": {
"color": "#666666",
"cursor": "default",
"fontSize": "11px"
},
"useHTML": false
}
},
"zAxis": {
"title": {
"text": "Multi Score"
}
},
"plotOptions": {
"series": {
"dataLabels": {
"enabled": false,
"format": null,
"distance": 30,
"align": "center",
"inside": null,
"allowOverlap": false,
"style": {
"fontSize": "11px"
}
},
"showInLegend": null,
"turboThreshold": 0,
"stacking": "",
"groupPadding": 0.2,
"centerInCategory": false,
"findNearestPointBy": "x"
}
},
"navigator": {
"enabled": false
},
"scrollbar": {
"enabled": false
},
"rangeSelector": {
"enabled": false,
"inputEnabled": false
},
"legend": {
"enabled": null,
"maxHeight": null,
"align": "center",
"verticalAlign": "bottom",
"layout": "horizontal",
"width": null,
"margin": 12,
"reversed": false
},
"series": [
{
"name": "c6a.16xlarge by Amazon Web Services",
"color": "#f7981d",
"data": [
{
"x": 1315.1750011969907,
"y": 31259.86758259549
},
{
"x": 1311.5137794834714,
"y": 30061.894996822793
},
{
"x": 1303.9075507638647,
"y": 30707.579596484888
},
{
"x": 1305.5783588001896,
"y": 29540.548923512055
},
{
"x": 1305.770429467675,
"y": 30735.435853605577
},
{
"x": 1303.8828465978593,
"y": 29918.47815910473
},
{
"x": 1304.441587946851,
"y": 31057.552761538886
},
{
"x": 1302.2176832064608,
"y": 30264.492343836333
},
{
"x": 1303.1626796969595,
"y": 30820.3719629826
},
{
"x": 1309.2794734543136,
"y": 31090.04370896807
},
{
"x": 1305.030740835062,
"y": 30321.646091549097
},
{
"x": 1302.9863313483277,
"y": 30864.929612975637
},
{
"x": 1305.4478167502696,
"y": 30455.334077020634
},
{
"x": 1305.9276194288948,
"y": 30973.021995549632
},
{
"x": 1311.2734668508588,
"y": 30473.95976081967
},
{
"x": 1302.65950661723,
"y": 29691.596359065337
},
{
"x": 1305.925723808572,
"y": 30499.154995462155
},
{
"x": 1303.0972123930055,
"y": 30794.51455217108
},
{
"x": 1305.6344132053678,
"y": 30741.346382536423
},
{
"x": 1304.8554853413661,
"y": 30527.42308893788
},
{
"x": 1311.9945157708855,
"y": 30787.70403923608
},
{
"x": 1315.0570485281846,
"y": 29973.293722226073
},
{
"x": 1306.2159250340019,
"y": 30685.125634901386
},
{
"x": 1309.9107889253207,
"y": 30123.702638123963
},
{
"x": 1306.7992967045382,
"y": 30536.61253807842
},
{
"x": 1307.4778305389768,
"y": 29449.620419294537
},
{
"x": 1312.2320224686416,
"y": 30531.308512874493
},
{
"x": 1305.6895041643409,
"y": 31041.518576150185
},
{
"x": 1310.7476336604918,
"y": 31025.145400336267
},
{
"x": 1304.2389129536841,
"y": 29191.722741553698
},
{
"x": 1302.8482446699968,
"y": 30678.387577077498
},
{
"x": 1305.0893898485383,
"y": 30348.744080394797
},
{
"x": 1305.5734973467856,
"y": 30456.18140354303
},
{
"x": 1306.920283856654,
"y": 29738.571573264566
},
{
"x": 1301.798869496643,
"y": 30519.07229783084
},
{
"x": 1309.162060364038,
"y": 30006.655623918887
},
{
"x": 1302.247572557475,
"y": 30623.846799253934
},
{
"x": 1306.7647825946026,
"y": 30416.035562864337
},
{
"x": 1308.4853912374704,
"y": 30091.090350474646
},
{
"x": 1311.3203594898255,
"y": 29676.505104953532
}
]
}
],
"drilldown": {},
"tooltip": {
"enabled": true,
"useHTML": false,
"format": null,
"headerFormat": "",
"pointFormat": "<span style=\"color:{series.color}\">Single</span>: <b>{point.x:.0f}</b><br><span style=\"color:{series.color}\">Multi</span>: <b>{point.y:.0f}</b>",
"footerFormat": "",
"shared": false,
"outside": false,
"valueDecimals": null,
"split": false
},
"annotations": null
},
"hc_type": "chart",
"id": "42158823746369116977728725356686825956"
}
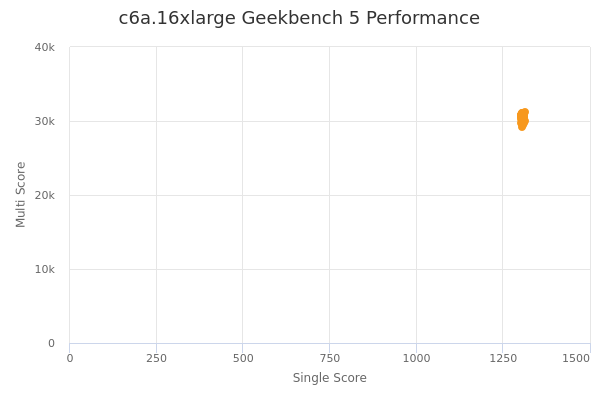
| Single | Multi | |
|---|---|---|
| Max | 1315 | 31260 |
| Average | 1307 | 30418 |
| Deviation | 3.49 | 488.17 |
| Min | 1302 | 29192 |
Sign up as Freemium to get more insight.