c6a.12xlarge by Amazon Web Services
Geekbench is a cross-platform processor benchmark with a scoring system that determines single-core and multi-core performance using loads simulating real-world scenarios. Geekbench 5 score is calculated with a reference score of 2500 representing the performance of the Intel Core i5-2520M @ 2.50 GHz. The software benchmark is available for Mac OS, Windows, Linux, Android and iOS platforms.
Specifications:
CPU
48
RAM
96.0 GB
Net
18750 Mbps
{
"configuration": {
"chart": {
"type": "scatter",
"polar": false,
"zoomType": "",
"options3d": {},
"height": null,
"width": null,
"margin": null,
"inverted": false,
"zooming": {}
},
"credits": {
"enabled": false
},
"title": {
"text": ""
},
"colorAxis": null,
"subtitle": {
"text": ""
},
"xAxis": {
"title": {
"text": [
"Single Score"
],
"useHTML": false,
"style": {
"color": "#666666"
}
},
"categories": null,
"lineWidth": 1,
"tickInterval": null,
"tickWidth": 1,
"tickLength": 10,
"tickPixelInterval": 100,
"plotLines": null,
"labels": {
"enabled": true,
"format": null,
"formatter": "",
"style": {
"color": "#666666",
"cursor": "default",
"fontSize": "11px"
},
"useHTML": false,
"step": 0
},
"plotBands": null,
"visible": true,
"floor": null,
"ceiling": null,
"type": "linear",
"min": 0,
"gridLineWidth": 1,
"gridLineColor": "#e6e6e6",
"minorTickInterval": null,
"minorTickWidth": 0,
"minTickInterval": null,
"startOnTick": true,
"endOnTick": true,
"tickmarkPlacement": 100,
"units": 100,
"minRange": 100
},
"yAxis": {
"title": {
"text": [
"Multi Score"
],
"useHTML": false,
"style": {
"color": "#666666"
}
},
"categories": null,
"plotLines": null,
"plotBands": null,
"lineWidth": null,
"tickInterval": null,
"tickLength": 10,
"floor": null,
"ceiling": null,
"gridLineInterpolation": null,
"gridLineWidth": 1,
"gridLineColor": "#e6e6e6",
"min": 0,
"max": null,
"minorTickInterval": null,
"minorTickWidth": 0,
"minTickInterval": null,
"startOnTick": true,
"endOnTick": true,
"minRange": null,
"type": "linear",
"tickmarkPlacement": null,
"labels": {
"enabled": true,
"formatter": null,
"style": {
"color": "#666666",
"cursor": "default",
"fontSize": "11px"
},
"useHTML": false
}
},
"zAxis": {
"title": {
"text": "Multi Score"
}
},
"plotOptions": {
"series": {
"dataLabels": {
"enabled": false,
"format": null,
"distance": 30,
"align": "center",
"inside": null,
"allowOverlap": false,
"style": {
"fontSize": "11px"
}
},
"showInLegend": null,
"turboThreshold": 0,
"stacking": "",
"groupPadding": 0.2,
"centerInCategory": false,
"findNearestPointBy": "x"
}
},
"navigator": {
"enabled": false
},
"scrollbar": {
"enabled": false
},
"rangeSelector": {
"enabled": false,
"inputEnabled": false
},
"legend": {
"enabled": null,
"maxHeight": null,
"align": "center",
"verticalAlign": "bottom",
"layout": "horizontal",
"width": null,
"margin": 12,
"reversed": false
},
"series": [
{
"name": "c6a.12xlarge by Amazon Web Services",
"color": "#f7981d",
"data": [
{
"x": 1310.2840425249126,
"y": 23954.450963477062
},
{
"x": 1317.4874879657357,
"y": 23966.411018281906
},
{
"x": 1310.8733747586768,
"y": 23987.431354860866
},
{
"x": 1309.4282591695467,
"y": 23892.633319594355
},
{
"x": 1309.8846263784305,
"y": 23836.478170087103
},
{
"x": 1306.8690514641457,
"y": 23878.40615076577
},
{
"x": 1311.463716905907,
"y": 24030.915388412024
},
{
"x": 1312.550444965193,
"y": 23777.01350040555
},
{
"x": 1313.8006495206084,
"y": 23568.5546795092
},
{
"x": 1311.43328208515,
"y": 23783.739596661184
},
{
"x": 1303.8194257854561,
"y": 23850.696675366456
},
{
"x": 1314.9679980839853,
"y": 23805.946953590555
},
{
"x": 1311.8339230530485,
"y": 24045.379820406546
},
{
"x": 1308.8368179596812,
"y": 23833.127989621808
},
{
"x": 1310.5915893227889,
"y": 23897.72816203907
},
{
"x": 1309.0796026964344,
"y": 23845.459316862507
},
{
"x": 1302.5843974501681,
"y": 23896.596992169947
},
{
"x": 1308.3017003550171,
"y": 23890.58277897781
},
{
"x": 1310.6835236882464,
"y": 23865.682788269398
},
{
"x": 1309.9358691320397,
"y": 23647.998031546915
}
]
}
],
"drilldown": {},
"tooltip": {
"enabled": true,
"useHTML": false,
"format": null,
"headerFormat": "",
"pointFormat": "<span style=\"color:{series.color}\">Single</span>: <b>{point.x:.0f}</b><br><span style=\"color:{series.color}\">Multi</span>: <b>{point.y:.0f}</b>",
"footerFormat": "",
"shared": false,
"outside": false,
"valueDecimals": null,
"split": false
},
"annotations": null
},
"hc_type": "chart",
"id": "242371293456392415359061290042772832602"
}
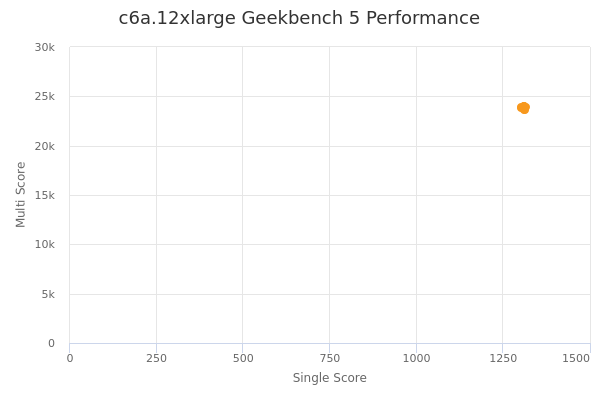
| Single | Multi | |
|---|---|---|
| Max | 1317 | 24045 |
| Average | 1310 | 23863 |
| Deviation | 3.30 | 112.28 |
| Min | 1303 | 23569 |
Sign up as Freemium to get more insight.