c6a.4xlarge by Amazon Web Services
Geekbench is a cross-platform processor benchmark with a scoring system that determines single-core and multi-core performance using loads simulating real-world scenarios. Geekbench 5 score is calculated with a reference score of 2500 representing the performance of the Intel Core i5-2520M @ 2.50 GHz. The software benchmark is available for Mac OS, Windows, Linux, Android and iOS platforms.
Specifications:
CPU
16
RAM
32.0 GB
Net
12500 Mbps
{
"configuration": {
"chart": {
"type": "scatter",
"polar": false,
"zoomType": "",
"options3d": {},
"height": null,
"width": null,
"margin": null,
"inverted": false,
"zooming": {}
},
"credits": {
"enabled": false
},
"title": {
"text": ""
},
"colorAxis": null,
"subtitle": {
"text": ""
},
"xAxis": {
"title": {
"text": [
"Single Score"
],
"useHTML": false,
"style": {
"color": "#666666"
}
},
"categories": null,
"lineWidth": 1,
"tickInterval": null,
"tickWidth": 1,
"tickLength": 10,
"tickPixelInterval": 100,
"plotLines": null,
"labels": {
"enabled": true,
"format": null,
"formatter": "",
"style": {
"color": "#666666",
"cursor": "default",
"fontSize": "11px"
},
"useHTML": false,
"step": 0
},
"plotBands": null,
"visible": true,
"floor": null,
"ceiling": null,
"type": "linear",
"min": 0,
"gridLineWidth": 1,
"gridLineColor": "#e6e6e6",
"minorTickInterval": null,
"minorTickWidth": 0,
"minTickInterval": null,
"startOnTick": true,
"endOnTick": true,
"tickmarkPlacement": 100,
"units": 100,
"minRange": 100
},
"yAxis": {
"title": {
"text": [
"Multi Score"
],
"useHTML": false,
"style": {
"color": "#666666"
}
},
"categories": null,
"plotLines": null,
"plotBands": null,
"lineWidth": null,
"tickInterval": null,
"tickLength": 10,
"floor": null,
"ceiling": null,
"gridLineInterpolation": null,
"gridLineWidth": 1,
"gridLineColor": "#e6e6e6",
"min": 0,
"max": null,
"minorTickInterval": null,
"minorTickWidth": 0,
"minTickInterval": null,
"startOnTick": true,
"endOnTick": true,
"minRange": null,
"type": "linear",
"tickmarkPlacement": null,
"labels": {
"enabled": true,
"formatter": null,
"style": {
"color": "#666666",
"cursor": "default",
"fontSize": "11px"
},
"useHTML": false
}
},
"zAxis": {
"title": {
"text": "Multi Score"
}
},
"plotOptions": {
"series": {
"dataLabels": {
"enabled": false,
"format": null,
"distance": 30,
"align": "center",
"inside": null,
"allowOverlap": false,
"style": {
"fontSize": "11px"
}
},
"showInLegend": null,
"turboThreshold": 0,
"stacking": "",
"groupPadding": 0.2,
"centerInCategory": false,
"findNearestPointBy": "x"
}
},
"navigator": {
"enabled": false
},
"scrollbar": {
"enabled": false
},
"rangeSelector": {
"enabled": false,
"inputEnabled": false
},
"legend": {
"enabled": null,
"maxHeight": null,
"align": "center",
"verticalAlign": "bottom",
"layout": "horizontal",
"width": null,
"margin": 12,
"reversed": false
},
"series": [
{
"name": "c6a.4xlarge by Amazon Web Services",
"color": "#f7981d",
"data": [
{
"x": 1114.5338676903855,
"y": 8947.94274164976
},
{
"x": 1053.7643134055481,
"y": 8589.988397330786
},
{
"x": 1151.4274916872318,
"y": 8793.948486992407
},
{
"x": 1022.7191280991187,
"y": 8334.510762986016
},
{
"x": 1128.2719399473228,
"y": 8866.032771965067
},
{
"x": 1082.714757323959,
"y": 8139.251806213254
},
{
"x": 1138.9807104718248,
"y": 8841.984254477453
},
{
"x": 1114.0862818523378,
"y": 8050.9267550606955
},
{
"x": 1154.7471239054469,
"y": 9015.66791939188
},
{
"x": 986.47843329799,
"y": 8071.166262323504
},
{
"x": 1148.3141556483617,
"y": 8962.442725112658
},
{
"x": 1123.4301730658035,
"y": 8311.639860604502
},
{
"x": 1139.4480329884982,
"y": 8400.84985768847
},
{
"x": 1088.6863049509705,
"y": 8623.64686291187
},
{
"x": 1145.1194444159378,
"y": 8830.982370615067
},
{
"x": 940.313004545379,
"y": 8782.97259020622
},
{
"x": 1148.1098097418092,
"y": 8769.510689002533
},
{
"x": 1039.7003573305915,
"y": 8307.377778159032
},
{
"x": 1143.6476062394486,
"y": 8993.0749336363
},
{
"x": 1108.3697039458655,
"y": 7744.14501338574
},
{
"x": 1117.8049714267522,
"y": 8910.664183176292
},
{
"x": 1117.9062349712408,
"y": 8832.1482852514
},
{
"x": 1126.9160112674977,
"y": 8922.640604922088
},
{
"x": 1106.1816254585215,
"y": 8845.755173717267
},
{
"x": 1123.3679788319478,
"y": 8918.434918797033
},
{
"x": 1137.9903551087057,
"y": 8865.280338001969
},
{
"x": 1122.981260471423,
"y": 8910.61730865423
},
{
"x": 1132.4166039473794,
"y": 8899.303517979663
},
{
"x": 1136.4140650592349,
"y": 8908.520572555732
},
{
"x": 1130.0546088652732,
"y": 8868.081964124747
},
{
"x": 1133.128233425918,
"y": 8920.582668629662
},
{
"x": 1129.4440641468154,
"y": 8914.31723158904
},
{
"x": 1132.1644248475764,
"y": 8926.34127018687
},
{
"x": 1118.2178170440625,
"y": 8868.853990471383
},
{
"x": 1132.3113856365437,
"y": 8883.523157108464
},
{
"x": 1114.7634098058625,
"y": 8830.217345320849
},
{
"x": 1086.8775566661338,
"y": 8965.46489273759
},
{
"x": 1121.1260920991665,
"y": 8883.856718422243
},
{
"x": 1131.8725948240171,
"y": 8919.407846524506
},
{
"x": 1102.0183675916667,
"y": 8846.283465118742
},
{
"x": 1262.6315103544366,
"y": 9624.29047371103
},
{
"x": 1319.2460457872016,
"y": 9590.259557541776
},
{
"x": 1310.215005175146,
"y": 9631.64750276782
}
]
}
],
"drilldown": {},
"tooltip": {
"enabled": true,
"useHTML": false,
"format": null,
"headerFormat": "",
"pointFormat": "<span style=\"color:{series.color}\">Single</span>: <b>{point.x:.0f}</b><br><span style=\"color:{series.color}\">Multi</span>: <b>{point.y:.0f}</b>",
"footerFormat": "",
"shared": false,
"outside": false,
"valueDecimals": null,
"split": false
},
"annotations": null
},
"hc_type": "chart",
"id": "89185144020794602561948624955863503412"
}
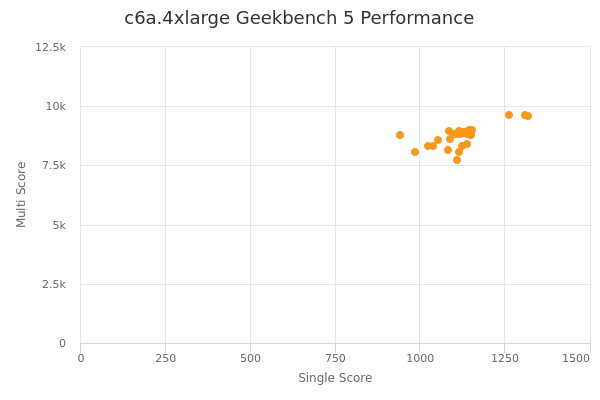
| Single | Multi | |
|---|---|---|
| Max | 1319 | 9632 |
| Average | 1124 | 8792 |
| Deviation | 64.28 | 370.53 |
| Min | 940 | 7744 |
Sign up as Freemium to get more insight.