c6a.48xlarge by Amazon Web Services
Geekbench is a cross-platform processor benchmark with a scoring system that determines single-core and multi-core performance using loads simulating real-world scenarios. Geekbench 5 score is calculated with a reference score of 2500 representing the performance of the Intel Core i5-2520M @ 2.50 GHz. The software benchmark is available for Mac OS, Windows, Linux, Android and iOS platforms.
Specifications:
CPU
192
RAM
384.0 GB
Net
50000 Mbps
{
"configuration": {
"chart": {
"type": "scatter",
"polar": false,
"zoomType": "",
"options3d": {},
"height": null,
"width": null,
"margin": null,
"inverted": false,
"zooming": {}
},
"credits": {
"enabled": false
},
"title": {
"text": ""
},
"colorAxis": null,
"subtitle": {
"text": ""
},
"xAxis": {
"title": {
"text": [
"Single Score"
],
"useHTML": false,
"style": {
"color": "#666666"
}
},
"categories": null,
"lineWidth": 1,
"tickInterval": null,
"tickWidth": 1,
"tickLength": 10,
"tickPixelInterval": 100,
"plotLines": null,
"labels": {
"enabled": true,
"format": null,
"formatter": "",
"style": {
"color": "#666666",
"cursor": "default",
"fontSize": "11px"
},
"useHTML": false,
"step": 0
},
"plotBands": null,
"visible": true,
"floor": null,
"ceiling": null,
"type": "linear",
"min": 0,
"gridLineWidth": 1,
"gridLineColor": "#e6e6e6",
"minorTickInterval": null,
"minorTickWidth": 0,
"minTickInterval": null,
"startOnTick": true,
"endOnTick": true,
"tickmarkPlacement": 100,
"units": 100,
"minRange": 100
},
"yAxis": {
"title": {
"text": [
"Multi Score"
],
"useHTML": false,
"style": {
"color": "#666666"
}
},
"categories": null,
"plotLines": null,
"plotBands": null,
"lineWidth": null,
"tickInterval": null,
"tickLength": 10,
"floor": null,
"ceiling": null,
"gridLineInterpolation": null,
"gridLineWidth": 1,
"gridLineColor": "#e6e6e6",
"min": 0,
"max": null,
"minorTickInterval": null,
"minorTickWidth": 0,
"minTickInterval": null,
"startOnTick": true,
"endOnTick": true,
"minRange": null,
"type": "linear",
"tickmarkPlacement": null,
"labels": {
"enabled": true,
"formatter": null,
"style": {
"color": "#666666",
"cursor": "default",
"fontSize": "11px"
},
"useHTML": false
}
},
"zAxis": {
"title": {
"text": "Multi Score"
}
},
"plotOptions": {
"series": {
"dataLabels": {
"enabled": false,
"format": null,
"distance": 30,
"align": "center",
"inside": null,
"allowOverlap": false,
"style": {
"fontSize": "11px"
}
},
"showInLegend": null,
"turboThreshold": 0,
"stacking": "",
"groupPadding": 0.2,
"centerInCategory": false,
"findNearestPointBy": "x"
}
},
"navigator": {
"enabled": false
},
"scrollbar": {
"enabled": false
},
"rangeSelector": {
"enabled": false,
"inputEnabled": false
},
"legend": {
"enabled": null,
"maxHeight": null,
"align": "center",
"verticalAlign": "bottom",
"layout": "horizontal",
"width": null,
"margin": 12,
"reversed": false
},
"series": [
{
"name": "c6a.48xlarge by Amazon Web Services",
"color": "#f7981d",
"data": [
{
"x": 1315.4496684045102,
"y": 62084.101914595296
},
{
"x": 1309.105617566532,
"y": 59280.876206740315
},
{
"x": 1304.279860438743,
"y": 60581.07527230793
},
{
"x": 1307.4193580022975,
"y": 59192.44904016085
},
{
"x": 1301.6283455416988,
"y": 58487.89865042134
},
{
"x": 1300.5077923173603,
"y": 61029.23186403151
},
{
"x": 1303.064999732364,
"y": 59890.042482171426
},
{
"x": 1300.1487325863293,
"y": 58888.434416674834
},
{
"x": 1301.1731624321576,
"y": 61673.56941203423
},
{
"x": 1303.820640486758,
"y": 60190.36462612851
},
{
"x": 1302.512057103423,
"y": 59162.94399692929
},
{
"x": 1305.88726831314,
"y": 59461.86837836937
},
{
"x": 1302.5387536947815,
"y": 61142.598433112966
},
{
"x": 1298.970960375095,
"y": 60912.93873360456
},
{
"x": 1305.3297108186778,
"y": 61290.453659610976
},
{
"x": 1302.4494326751615,
"y": 58471.09412146451
},
{
"x": 1302.771314160071,
"y": 61420.26190850546
},
{
"x": 1301.305884985403,
"y": 61344.25379583834
},
{
"x": 1301.7900985642439,
"y": 59384.700835057156
},
{
"x": 1303.158068060934,
"y": 57573.48501735214
}
]
}
],
"drilldown": {},
"tooltip": {
"enabled": true,
"useHTML": false,
"format": null,
"headerFormat": "",
"pointFormat": "<span style=\"color:{series.color}\">Single</span>: <b>{point.x:.0f}</b><br><span style=\"color:{series.color}\">Multi</span>: <b>{point.y:.0f}</b>",
"footerFormat": "",
"shared": false,
"outside": false,
"valueDecimals": null,
"split": false
},
"annotations": null
},
"hc_type": "chart",
"id": "318762413551204377363916085843673012585"
}
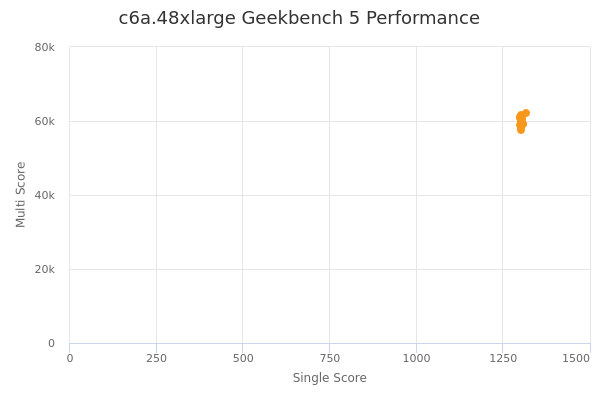
| Single | Multi | |
|---|---|---|
| Max | 1315 | 62084 |
| Average | 1304 | 60073 |
| Deviation | 3.61 | 1232.82 |
| Min | 1299 | 57573 |
Sign up as Freemium to get more insight.