c6a.xlarge by Amazon Web Services
Geekbench is a cross-platform processor benchmark with a scoring system that determines single-core and multi-core performance using loads simulating real-world scenarios. Geekbench 5 score is calculated with a reference score of 2500 representing the performance of the Intel Core i5-2520M @ 2.50 GHz. The software benchmark is available for Mac OS, Windows, Linux, Android and iOS platforms.
Specifications:
CPU
4
RAM
8.0 GB
Net
12500 Mbps
{
"configuration": {
"chart": {
"type": "scatter",
"polar": false,
"zoomType": "",
"options3d": {},
"height": null,
"width": null,
"margin": null,
"inverted": false,
"zooming": {}
},
"credits": {
"enabled": false
},
"title": {
"text": ""
},
"colorAxis": null,
"subtitle": {
"text": ""
},
"xAxis": {
"title": {
"text": [
"Single Score"
],
"useHTML": false,
"style": {
"color": "#666666"
}
},
"categories": null,
"lineWidth": 1,
"tickInterval": null,
"tickWidth": 1,
"tickLength": 10,
"tickPixelInterval": 100,
"plotLines": null,
"labels": {
"enabled": true,
"format": null,
"formatter": "",
"style": {
"color": "#666666",
"cursor": "default",
"fontSize": "11px"
},
"useHTML": false,
"step": 0
},
"plotBands": null,
"visible": true,
"floor": null,
"ceiling": null,
"type": "linear",
"min": 0,
"gridLineWidth": 1,
"gridLineColor": "#e6e6e6",
"minorTickInterval": null,
"minorTickWidth": 0,
"minTickInterval": null,
"startOnTick": true,
"endOnTick": true,
"tickmarkPlacement": 100,
"units": 100,
"minRange": 100
},
"yAxis": {
"title": {
"text": [
"Multi Score"
],
"useHTML": false,
"style": {
"color": "#666666"
}
},
"categories": null,
"plotLines": null,
"plotBands": null,
"lineWidth": null,
"tickInterval": null,
"tickLength": 10,
"floor": null,
"ceiling": null,
"gridLineInterpolation": null,
"gridLineWidth": 1,
"gridLineColor": "#e6e6e6",
"min": 0,
"max": null,
"minorTickInterval": null,
"minorTickWidth": 0,
"minTickInterval": null,
"startOnTick": true,
"endOnTick": true,
"minRange": null,
"type": "linear",
"tickmarkPlacement": null,
"labels": {
"enabled": true,
"formatter": null,
"style": {
"color": "#666666",
"cursor": "default",
"fontSize": "11px"
},
"useHTML": false
}
},
"zAxis": {
"title": {
"text": "Multi Score"
}
},
"plotOptions": {
"series": {
"dataLabels": {
"enabled": false,
"format": null,
"distance": 30,
"align": "center",
"inside": null,
"allowOverlap": false,
"style": {
"fontSize": "11px"
}
},
"showInLegend": null,
"turboThreshold": 0,
"stacking": "",
"groupPadding": 0.2,
"centerInCategory": false,
"findNearestPointBy": "x"
}
},
"navigator": {
"enabled": false
},
"scrollbar": {
"enabled": false
},
"rangeSelector": {
"enabled": false,
"inputEnabled": false
},
"legend": {
"enabled": null,
"maxHeight": null,
"align": "center",
"verticalAlign": "bottom",
"layout": "horizontal",
"width": null,
"margin": 12,
"reversed": false
},
"series": [
{
"name": "c6a.xlarge by Amazon Web Services",
"color": "#f7981d",
"data": [
{
"x": 1060.369666181682,
"y": 2764.4142284559975
},
{
"x": 969.9098232940757,
"y": 2641.98060011109
},
{
"x": 1068.4964312755212,
"y": 2752.568534963618
},
{
"x": 1031.8949801153576,
"y": 2682.382411157053
},
{
"x": 1060.2778751742587,
"y": 2790.343818128288
},
{
"x": 991.6698116554428,
"y": 2723.1192218529995
},
{
"x": 1045.3495715244624,
"y": 2703.5392281121676
},
{
"x": 1080.2356736133368,
"y": 2553.605539506983
},
{
"x": 1054.2885869555373,
"y": 2839.2577670578085
},
{
"x": 1003.5123298176245,
"y": 2528.681370807567
},
{
"x": 1037.085283965182,
"y": 2671.082500820081
},
{
"x": 993.8971649215297,
"y": 2646.1039547044657
},
{
"x": 1080.2998196841204,
"y": 2837.4396515700364
},
{
"x": 1098.7967621343819,
"y": 2686.4410572863126
},
{
"x": 1016.0113587642674,
"y": 2767.0162912492933
},
{
"x": 994.1359701894401,
"y": 2697.2971919192123
},
{
"x": 1075.3605905701324,
"y": 2544.758275302859
},
{
"x": 984.5922997590537,
"y": 2580.2380106018054
},
{
"x": 1017.6828068624498,
"y": 2732.79667814562
},
{
"x": 1028.044116578697,
"y": 2784.617491483569
}
]
}
],
"drilldown": {},
"tooltip": {
"enabled": true,
"useHTML": false,
"format": null,
"headerFormat": "",
"pointFormat": "<span style=\"color:{series.color}\">Single</span>: <b>{point.x:.0f}</b><br><span style=\"color:{series.color}\">Multi</span>: <b>{point.y:.0f}</b>",
"footerFormat": "",
"shared": false,
"outside": false,
"valueDecimals": null,
"split": false
},
"annotations": null
},
"hc_type": "chart",
"id": "239225497817732565423138284185329693600"
}
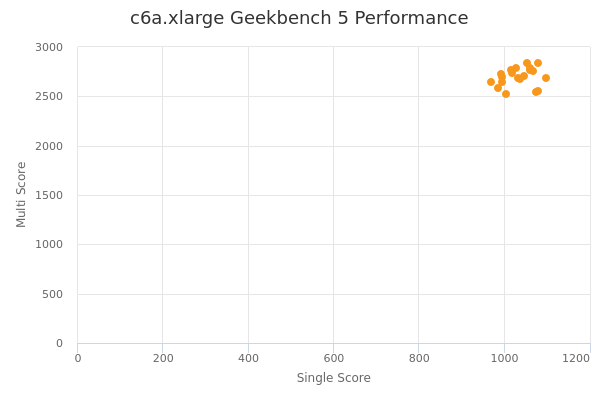
| Single | Multi | |
|---|---|---|
| Max | 1099 | 2839 |
| Average | 1035 | 2696 |
| Deviation | 36.34 | 90.33 |
| Min | 970 | 2529 |
Sign up as Freemium to get more insight.