8CPU 16GB VHP-INTEL 350GB NVMe by Vultr
Geekbench is a cross-platform processor benchmark with a scoring system that determines single-core and multi-core performance using loads simulating real-world scenarios. Geekbench 5 score is calculated with a reference score of 2500 representing the performance of the Intel Core i5-2520M @ 2.50 GHz. The software benchmark is available for Mac OS, Windows, Linux, Android and iOS platforms.
Specifications:
CPU
8
RAM
16.0 GB
Root
350 GB
8CPU 16GB VHP-INTEL 350GB NVMe root
{
"configuration": {
"chart": {
"type": "scatter",
"polar": false,
"zoomType": "",
"options3d": {},
"height": null,
"width": null,
"margin": null,
"inverted": false,
"zooming": {}
},
"credits": {
"enabled": false
},
"title": {
"text": ""
},
"colorAxis": null,
"subtitle": {
"text": ""
},
"xAxis": {
"title": {
"text": [
"Single Score"
],
"useHTML": false,
"style": {
"color": "#666666"
}
},
"categories": null,
"lineWidth": 1,
"tickInterval": null,
"tickWidth": 1,
"tickLength": 10,
"tickPixelInterval": 100,
"plotLines": null,
"labels": {
"enabled": true,
"format": null,
"formatter": "",
"style": {
"color": "#666666",
"cursor": "default",
"fontSize": "11px"
},
"useHTML": false,
"step": 0
},
"plotBands": null,
"visible": true,
"floor": null,
"ceiling": null,
"type": "linear",
"min": 0,
"gridLineWidth": 1,
"gridLineColor": "#e6e6e6",
"minorTickInterval": null,
"minorTickWidth": 0,
"minTickInterval": null,
"startOnTick": true,
"endOnTick": true,
"tickmarkPlacement": 100,
"units": 100,
"minRange": 100
},
"yAxis": {
"title": {
"text": [
"Multi Score"
],
"useHTML": false,
"style": {
"color": "#666666"
}
},
"categories": null,
"plotLines": null,
"plotBands": null,
"lineWidth": null,
"tickInterval": null,
"tickLength": 10,
"floor": null,
"ceiling": null,
"gridLineInterpolation": null,
"gridLineWidth": 1,
"gridLineColor": "#e6e6e6",
"min": 0,
"max": null,
"minorTickInterval": null,
"minorTickWidth": 0,
"minTickInterval": null,
"startOnTick": true,
"endOnTick": true,
"minRange": null,
"type": "linear",
"tickmarkPlacement": null,
"labels": {
"enabled": true,
"formatter": null,
"style": {
"color": "#666666",
"cursor": "default",
"fontSize": "11px"
},
"useHTML": false
}
},
"zAxis": {
"title": {
"text": "Multi Score"
}
},
"plotOptions": {
"series": {
"dataLabels": {
"enabled": false,
"format": null,
"distance": 30,
"align": "center",
"inside": null,
"allowOverlap": false,
"style": {
"fontSize": "11px"
}
},
"showInLegend": null,
"turboThreshold": 0,
"stacking": "",
"groupPadding": 0.2,
"centerInCategory": false,
"findNearestPointBy": "x"
}
},
"navigator": {
"enabled": false
},
"scrollbar": {
"enabled": false
},
"rangeSelector": {
"enabled": false,
"inputEnabled": false
},
"legend": {
"enabled": null,
"maxHeight": null,
"align": "center",
"verticalAlign": "bottom",
"layout": "horizontal",
"width": null,
"margin": 12,
"reversed": false
},
"series": [
{
"name": "8CPU 16GB VHP-INTEL 350GB NVMe by Vultr",
"color": "#3AB1F2",
"data": [
{
"x": 890.8855506918167,
"y": 6591.368320295991
},
{
"x": 892.7999950794348,
"y": 6053.30663884271
},
{
"x": 886.2830664078756,
"y": 6556.674071320513
},
{
"x": 859.2662900210676,
"y": 5781.917021966533
},
{
"x": 887.8961153093261,
"y": 6488.914996607049
},
{
"x": 865.581908792567,
"y": 6099.409648496556
},
{
"x": 890.853618799754,
"y": 6436.908559108027
},
{
"x": 897.2256706628177,
"y": 5896.382619374073
},
{
"x": 885.4649109317379,
"y": 6524.4812319332505
},
{
"x": 898.0598010092016,
"y": 5813.573846991255
},
{
"x": 878.9488331124542,
"y": 6432.767196100847
},
{
"x": 896.078868960185,
"y": 6011.247106533972
},
{
"x": 897.6065215873111,
"y": 6563.30644591201
},
{
"x": 853.2277619150609,
"y": 5869.33259100277
},
{
"x": 901.6289857022956,
"y": 6590.537095864422
},
{
"x": 888.068538814692,
"y": 5826.921930085007
},
{
"x": 889.8060156419326,
"y": 6487.290116124192
},
{
"x": 896.1928263867669,
"y": 6170.237704769204
},
{
"x": 894.6128636947228,
"y": 6530.918179108107
},
{
"x": 890.185587774045,
"y": 6023.641955142275
}
]
}
],
"drilldown": {},
"tooltip": {
"enabled": true,
"useHTML": false,
"format": null,
"headerFormat": "",
"pointFormat": "<span style=\"color:{series.color}\">Single</span>: <b>{point.x:.0f}</b><br><span style=\"color:{series.color}\">Multi</span>: <b>{point.y:.0f}</b>",
"footerFormat": "",
"shared": false,
"outside": false,
"valueDecimals": null,
"split": false
},
"annotations": null
},
"hc_type": "chart",
"id": "188519520063700033504487753093793328089"
}
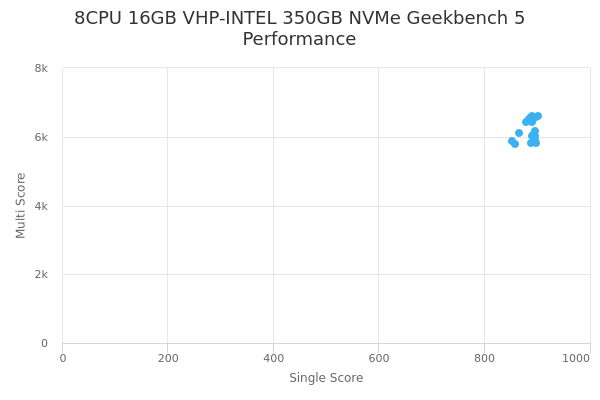
| Single | Multi | |
|---|---|---|
| Max | 902 | 6591 |
| Average | 887 | 6237 |
| Deviation | 12.84 | 299.33 |
| Min | 853 | 5782 |