4CPU 12GB VHP-INTEL 260GB NVMe by Vultr
Geekbench is a cross-platform processor benchmark with a scoring system that determines single-core and multi-core performance using loads simulating real-world scenarios. Geekbench 5 score is calculated with a reference score of 2500 representing the performance of the Intel Core i5-2520M @ 2.50 GHz. The software benchmark is available for Mac OS, Windows, Linux, Android and iOS platforms.
Specifications:
CPU
4
RAM
12.0 GB
Root
260 GB
4CPU 12GB VHP-INTEL 260GB NVMe root
{
"configuration": {
"chart": {
"type": "scatter",
"polar": false,
"zoomType": "",
"options3d": {},
"height": null,
"width": null,
"margin": null,
"inverted": false,
"zooming": {}
},
"credits": {
"enabled": false
},
"title": {
"text": ""
},
"colorAxis": null,
"subtitle": {
"text": ""
},
"xAxis": {
"title": {
"text": [
"Single Score"
],
"useHTML": false,
"style": {
"color": "#666666"
}
},
"categories": null,
"lineWidth": 1,
"tickInterval": null,
"tickWidth": 1,
"tickLength": 10,
"tickPixelInterval": 100,
"plotLines": null,
"labels": {
"enabled": true,
"format": null,
"formatter": "",
"style": {
"color": "#666666",
"cursor": "default",
"fontSize": "11px"
},
"useHTML": false,
"step": 0
},
"plotBands": null,
"visible": true,
"floor": null,
"ceiling": null,
"type": "linear",
"min": 0,
"gridLineWidth": 1,
"gridLineColor": "#e6e6e6",
"minorTickInterval": null,
"minorTickWidth": 0,
"minTickInterval": null,
"startOnTick": true,
"endOnTick": true,
"tickmarkPlacement": 100,
"units": 100,
"minRange": 100
},
"yAxis": {
"title": {
"text": [
"Multi Score"
],
"useHTML": false,
"style": {
"color": "#666666"
}
},
"categories": null,
"plotLines": null,
"plotBands": null,
"lineWidth": null,
"tickInterval": null,
"tickLength": 10,
"floor": null,
"ceiling": null,
"gridLineInterpolation": null,
"gridLineWidth": 1,
"gridLineColor": "#e6e6e6",
"min": 0,
"max": null,
"minorTickInterval": null,
"minorTickWidth": 0,
"minTickInterval": null,
"startOnTick": true,
"endOnTick": true,
"minRange": null,
"type": "linear",
"tickmarkPlacement": null,
"labels": {
"enabled": true,
"formatter": null,
"style": {
"color": "#666666",
"cursor": "default",
"fontSize": "11px"
},
"useHTML": false
}
},
"zAxis": {
"title": {
"text": "Multi Score"
}
},
"plotOptions": {
"series": {
"dataLabels": {
"enabled": false,
"format": null,
"distance": 30,
"align": "center",
"inside": null,
"allowOverlap": false,
"style": {
"fontSize": "11px"
}
},
"showInLegend": null,
"turboThreshold": 0,
"stacking": "",
"groupPadding": 0.2,
"centerInCategory": false,
"findNearestPointBy": "x"
}
},
"navigator": {
"enabled": false
},
"scrollbar": {
"enabled": false
},
"rangeSelector": {
"enabled": false,
"inputEnabled": false
},
"legend": {
"enabled": null,
"maxHeight": null,
"align": "center",
"verticalAlign": "bottom",
"layout": "horizontal",
"width": null,
"margin": 12,
"reversed": false
},
"series": [
{
"name": "4CPU 12GB VHP-INTEL 260GB NVMe by Vultr",
"color": "#3AB1F2",
"data": [
{
"x": 920.6218999213354,
"y": 3362.738016592749
},
{
"x": 848.4102687672284,
"y": 3290.9454984466192
},
{
"x": 924.2956500506458,
"y": 3516.1055131993808
},
{
"x": 860.6794760703922,
"y": 3251.5684630426977
},
{
"x": 935.7033526307729,
"y": 3555.383622313359
},
{
"x": 855.4613604252968,
"y": 3280.9248949892635
},
{
"x": 932.7829972330717,
"y": 3450.300367234353
},
{
"x": 859.5999330799748,
"y": 3241.1207000293243
},
{
"x": 917.4234834876347,
"y": 3533.550152061066
},
{
"x": 848.8945385379754,
"y": 3254.693674629859
},
{
"x": 932.1891094935427,
"y": 3615.906230355473
},
{
"x": 842.4728310755061,
"y": 3324.556905983518
},
{
"x": 914.5651567508401,
"y": 3521.2897076853815
},
{
"x": 858.7061042659633,
"y": 3278.039961151184
},
{
"x": 943.4029343474049,
"y": 3547.6286903931714
},
{
"x": 846.4926819954003,
"y": 3323.4332661538083
},
{
"x": 932.2948359131487,
"y": 3595.19718463509
},
{
"x": 861.0797762889686,
"y": 3298.473839676154
},
{
"x": 942.3765787195377,
"y": 3462.375033138474
},
{
"x": 852.6856716744538,
"y": 3263.0539201151005
}
]
}
],
"drilldown": {},
"tooltip": {
"enabled": true,
"useHTML": false,
"format": null,
"headerFormat": "",
"pointFormat": "<span style=\"color:{series.color}\">Single</span>: <b>{point.x:.0f}</b><br><span style=\"color:{series.color}\">Multi</span>: <b>{point.y:.0f}</b>",
"footerFormat": "",
"shared": false,
"outside": false,
"valueDecimals": null,
"split": false
},
"annotations": null
},
"hc_type": "chart",
"id": "29312748234221994957434778389018326390"
}
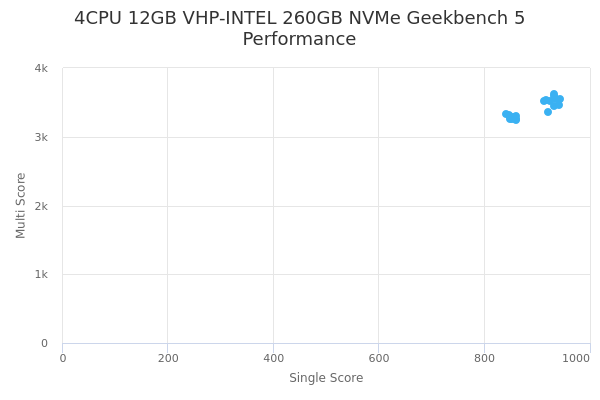
| Single | Multi | |
|---|---|---|
| Max | 943 | 3616 |
| Average | 892 | 3398 |
| Deviation | 38.90 | 129.30 |
| Min | 842 | 3241 |