1CPU 1GB VHP-INTEL 25GB NVMe by Vultr
Geekbench is a cross-platform processor benchmark with a scoring system that determines single-core and multi-core performance using loads simulating real-world scenarios. Geekbench 5 score is calculated with a reference score of 2500 representing the performance of the Intel Core i5-2520M @ 2.50 GHz. The software benchmark is available for Mac OS, Windows, Linux, Android and iOS platforms.
Specifications:
CPU
1
RAM
1.0 GB
Root
25 GB
1CPU 1GB VHP-INTEL 25GB NVMe root
{
"configuration": {
"chart": {
"type": "scatter",
"polar": false,
"zoomType": "",
"options3d": {},
"height": null,
"width": null,
"margin": null,
"inverted": false,
"zooming": {}
},
"credits": {
"enabled": false
},
"title": {
"text": ""
},
"colorAxis": null,
"subtitle": {
"text": ""
},
"xAxis": {
"title": {
"text": [
"Single Score"
],
"useHTML": false,
"style": {
"color": "#666666"
}
},
"categories": null,
"lineWidth": 1,
"tickInterval": null,
"tickWidth": 1,
"tickLength": 10,
"tickPixelInterval": 100,
"plotLines": null,
"labels": {
"enabled": true,
"format": null,
"formatter": "",
"style": {
"color": "#666666",
"cursor": "default",
"fontSize": "11px"
},
"useHTML": false,
"step": 0
},
"plotBands": null,
"visible": true,
"floor": null,
"ceiling": null,
"type": "linear",
"min": 0,
"gridLineWidth": 1,
"gridLineColor": "#e6e6e6",
"minorTickInterval": null,
"minorTickWidth": 0,
"minTickInterval": null,
"startOnTick": true,
"endOnTick": true,
"tickmarkPlacement": 100,
"units": 100,
"minRange": 100
},
"yAxis": {
"title": {
"text": [
"Multi Score"
],
"useHTML": false,
"style": {
"color": "#666666"
}
},
"categories": null,
"plotLines": null,
"plotBands": null,
"lineWidth": null,
"tickInterval": null,
"tickLength": 10,
"floor": null,
"ceiling": null,
"gridLineInterpolation": null,
"gridLineWidth": 1,
"gridLineColor": "#e6e6e6",
"min": 0,
"max": null,
"minorTickInterval": null,
"minorTickWidth": 0,
"minTickInterval": null,
"startOnTick": true,
"endOnTick": true,
"minRange": null,
"type": "linear",
"tickmarkPlacement": null,
"labels": {
"enabled": true,
"formatter": null,
"style": {
"color": "#666666",
"cursor": "default",
"fontSize": "11px"
},
"useHTML": false
}
},
"zAxis": {
"title": {
"text": "Multi Score"
}
},
"plotOptions": {
"series": {
"dataLabels": {
"enabled": false,
"format": null,
"distance": 30,
"align": "center",
"inside": null,
"allowOverlap": false,
"style": {
"fontSize": "11px"
}
},
"showInLegend": null,
"turboThreshold": 0,
"stacking": "",
"groupPadding": 0.2,
"centerInCategory": false,
"findNearestPointBy": "x"
}
},
"navigator": {
"enabled": false
},
"scrollbar": {
"enabled": false
},
"rangeSelector": {
"enabled": false,
"inputEnabled": false
},
"legend": {
"enabled": null,
"maxHeight": null,
"align": "center",
"verticalAlign": "bottom",
"layout": "horizontal",
"width": null,
"margin": 12,
"reversed": false
},
"series": [
{
"name": "1CPU 1GB VHP-INTEL 25GB NVMe by Vultr",
"color": "#3AB1F2",
"data": [
{
"x": 901.4426552624177,
"y": 911.4717670403195
},
{
"x": 844.7515073501272,
"y": 825.9993677610435
},
{
"x": 915.1748955863131,
"y": 917.7538982849644
},
{
"x": 841.8379842110157,
"y": 841.6467668898599
},
{
"x": 918.0689952907139,
"y": 930.3744272200106
},
{
"x": 860.3604460711549,
"y": 845.8756915816209
},
{
"x": 915.1724990763472,
"y": 916.148355079775
},
{
"x": 842.3470295446054,
"y": 853.7130785440495
},
{
"x": 901.9307132859117,
"y": 922.1239442022825
},
{
"x": 856.9768312472579,
"y": 826.7181569395858
},
{
"x": 935.4178696457367,
"y": 919.6475528193107
},
{
"x": 860.912455886114,
"y": 839.2998319624326
},
{
"x": 909.4801369843667,
"y": 928.9810972572726
},
{
"x": 849.1481076439434,
"y": 850.6978036308285
},
{
"x": 924.8451054330501,
"y": 913.2818804584615
},
{
"x": 847.1484415164333,
"y": 842.5860110070896
},
{
"x": 905.4548838480262,
"y": 913.5373051833828
},
{
"x": 850.2108654729894,
"y": 836.7245013661344
},
{
"x": 928.8847963133915,
"y": 923.5120030439313
},
{
"x": 852.5582095356751,
"y": 851.6038490879076
}
]
}
],
"drilldown": {},
"tooltip": {
"enabled": true,
"useHTML": false,
"format": null,
"headerFormat": "",
"pointFormat": "<span style=\"color:{series.color}\">Single</span>: <b>{point.x:.0f}</b><br><span style=\"color:{series.color}\">Multi</span>: <b>{point.y:.0f}</b>",
"footerFormat": "",
"shared": false,
"outside": false,
"valueDecimals": null,
"split": false
},
"annotations": null
},
"hc_type": "chart",
"id": "35524620787248327102944592708100551306"
}
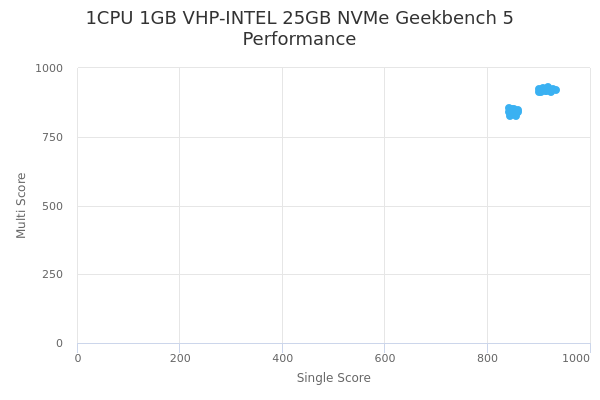
| Single | Multi | |
|---|---|---|
| Max | 935 | 930 |
| Average | 883 | 881 |
| Deviation | 33.71 | 39.87 |
| Min | 842 | 826 |