2CPU 4GB VHP-INTEL 100GB NVMe by Vultr
Geekbench is a cross-platform processor benchmark with a scoring system that determines single-core and multi-core performance using loads simulating real-world scenarios. Geekbench 5 score is calculated with a reference score of 2500 representing the performance of the Intel Core i5-2520M @ 2.50 GHz. The software benchmark is available for Mac OS, Windows, Linux, Android and iOS platforms.
Specifications:
CPU
2
RAM
4.0 GB
Root
100 GB
2CPU 4GB VHP-INTEL 100GB NVMe root
{
"configuration": {
"chart": {
"type": "scatter",
"polar": false,
"zoomType": "",
"options3d": {},
"height": null,
"width": null,
"margin": null,
"inverted": false,
"zooming": {}
},
"credits": {
"enabled": false
},
"title": {
"text": ""
},
"colorAxis": null,
"subtitle": {
"text": ""
},
"xAxis": {
"title": {
"text": [
"Single Score"
],
"useHTML": false,
"style": {
"color": "#666666"
}
},
"categories": null,
"lineWidth": 1,
"tickInterval": null,
"tickWidth": 1,
"tickLength": 10,
"tickPixelInterval": 100,
"plotLines": null,
"labels": {
"enabled": true,
"format": null,
"formatter": "",
"style": {
"color": "#666666",
"cursor": "default",
"fontSize": "11px"
},
"useHTML": false,
"step": 0
},
"plotBands": null,
"visible": true,
"floor": null,
"ceiling": null,
"type": "linear",
"min": 0,
"gridLineWidth": 1,
"gridLineColor": "#e6e6e6",
"minorTickInterval": null,
"minorTickWidth": 0,
"minTickInterval": null,
"startOnTick": true,
"endOnTick": true,
"tickmarkPlacement": 100,
"units": 100,
"minRange": 100
},
"yAxis": {
"title": {
"text": [
"Multi Score"
],
"useHTML": false,
"style": {
"color": "#666666"
}
},
"categories": null,
"plotLines": null,
"plotBands": null,
"lineWidth": null,
"tickInterval": null,
"tickLength": 10,
"floor": null,
"ceiling": null,
"gridLineInterpolation": null,
"gridLineWidth": 1,
"gridLineColor": "#e6e6e6",
"min": 0,
"max": null,
"minorTickInterval": null,
"minorTickWidth": 0,
"minTickInterval": null,
"startOnTick": true,
"endOnTick": true,
"minRange": null,
"type": "linear",
"tickmarkPlacement": null,
"labels": {
"enabled": true,
"formatter": null,
"style": {
"color": "#666666",
"cursor": "default",
"fontSize": "11px"
},
"useHTML": false
}
},
"zAxis": {
"title": {
"text": "Multi Score"
}
},
"plotOptions": {
"series": {
"dataLabels": {
"enabled": false,
"format": null,
"distance": 30,
"align": "center",
"inside": null,
"allowOverlap": false,
"style": {
"fontSize": "11px"
}
},
"showInLegend": null,
"turboThreshold": 0,
"stacking": "",
"groupPadding": 0.2,
"centerInCategory": false,
"findNearestPointBy": "x"
}
},
"navigator": {
"enabled": false
},
"scrollbar": {
"enabled": false
},
"rangeSelector": {
"enabled": false,
"inputEnabled": false
},
"legend": {
"enabled": null,
"maxHeight": null,
"align": "center",
"verticalAlign": "bottom",
"layout": "horizontal",
"width": null,
"margin": 12,
"reversed": false
},
"series": [
{
"name": "2CPU 4GB VHP-INTEL 100GB NVMe by Vultr",
"color": "#3AB1F2",
"data": [
{
"x": 906.5159835219335,
"y": 1766.44904234941
},
{
"x": 866.5303676292785,
"y": 1702.861341428043
},
{
"x": 922.2606677336578,
"y": 1785.4399731422513
},
{
"x": 879.3195551707508,
"y": 1699.6317283303545
},
{
"x": 925.7732445623594,
"y": 1780.9400524582752
},
{
"x": 870.3683087853158,
"y": 1735.166113581875
},
{
"x": 904.4979734560993,
"y": 1797.2427015153212
},
{
"x": 885.4161508512044,
"y": 1692.8174775786283
},
{
"x": 905.5199498647291,
"y": 1781.5674854184506
},
{
"x": 879.3356499612651,
"y": 1712.257377692422
},
{
"x": 901.9859011282724,
"y": 1759.9903553152476
},
{
"x": 870.0611145049668,
"y": 1732.0997920825052
},
{
"x": 899.8455339962471,
"y": 1780.248998146468
},
{
"x": 883.4153208725174,
"y": 1700.894501250666
},
{
"x": 920.7910899845547,
"y": 1785.10353122977
},
{
"x": 882.7755257809106,
"y": 1667.2125239070303
},
{
"x": 903.3766814571704,
"y": 1776.7461334847364
},
{
"x": 871.1583171174825,
"y": 1624.4397169370404
},
{
"x": 911.1113992665488,
"y": 1794.8637655727016
},
{
"x": 854.6037990831616,
"y": 1713.0347205793194
}
]
}
],
"drilldown": {},
"tooltip": {
"enabled": true,
"useHTML": false,
"format": null,
"headerFormat": "",
"pointFormat": "<span style=\"color:{series.color}\">Single</span>: <b>{point.x:.0f}</b><br><span style=\"color:{series.color}\">Multi</span>: <b>{point.y:.0f}</b>",
"footerFormat": "",
"shared": false,
"outside": false,
"valueDecimals": null,
"split": false
},
"annotations": null
},
"hc_type": "chart",
"id": "315819606907683966283390972844554115537"
}
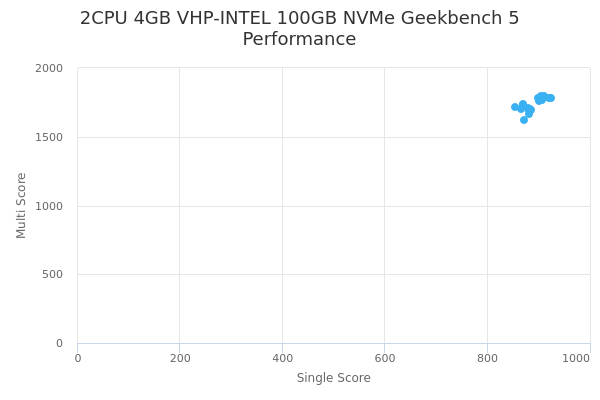
| Single | Multi | |
|---|---|---|
| Max | 926 | 1797 |
| Average | 892 | 1739 |
| Deviation | 20.05 | 47.36 |
| Min | 855 | 1624 |