4CPU 8GB VHP-INTEL 180GB NVMe by Vultr
Geekbench is a cross-platform processor benchmark with a scoring system that determines single-core and multi-core performance using loads simulating real-world scenarios. Geekbench 5 score is calculated with a reference score of 2500 representing the performance of the Intel Core i5-2520M @ 2.50 GHz. The software benchmark is available for Mac OS, Windows, Linux, Android and iOS platforms.
Specifications:
CPU
4
RAM
8.0 GB
Root
180 GB
4CPU 8GB VHP-INTEL 180GB NVMe root
{
"configuration": {
"chart": {
"type": "scatter",
"polar": false,
"zoomType": "",
"options3d": {},
"height": null,
"width": null,
"margin": null,
"inverted": false,
"zooming": {}
},
"credits": {
"enabled": false
},
"title": {
"text": ""
},
"colorAxis": null,
"subtitle": {
"text": ""
},
"xAxis": {
"title": {
"text": [
"Single Score"
],
"useHTML": false,
"style": {
"color": "#666666"
}
},
"categories": null,
"lineWidth": 1,
"tickInterval": null,
"tickWidth": 1,
"tickLength": 10,
"tickPixelInterval": 100,
"plotLines": null,
"labels": {
"enabled": true,
"format": null,
"formatter": "",
"style": {
"color": "#666666",
"cursor": "default",
"fontSize": "11px"
},
"useHTML": false,
"step": 0
},
"plotBands": null,
"visible": true,
"floor": null,
"ceiling": null,
"type": "linear",
"min": 0,
"gridLineWidth": 1,
"gridLineColor": "#e6e6e6",
"minorTickInterval": null,
"minorTickWidth": 0,
"minTickInterval": null,
"startOnTick": true,
"endOnTick": true,
"tickmarkPlacement": 100,
"units": 100,
"minRange": 100
},
"yAxis": {
"title": {
"text": [
"Multi Score"
],
"useHTML": false,
"style": {
"color": "#666666"
}
},
"categories": null,
"plotLines": null,
"plotBands": null,
"lineWidth": null,
"tickInterval": null,
"tickLength": 10,
"floor": null,
"ceiling": null,
"gridLineInterpolation": null,
"gridLineWidth": 1,
"gridLineColor": "#e6e6e6",
"min": 0,
"max": null,
"minorTickInterval": null,
"minorTickWidth": 0,
"minTickInterval": null,
"startOnTick": true,
"endOnTick": true,
"minRange": null,
"type": "linear",
"tickmarkPlacement": null,
"labels": {
"enabled": true,
"formatter": null,
"style": {
"color": "#666666",
"cursor": "default",
"fontSize": "11px"
},
"useHTML": false
}
},
"zAxis": {
"title": {
"text": "Multi Score"
}
},
"plotOptions": {
"series": {
"dataLabels": {
"enabled": false,
"format": null,
"distance": 30,
"align": "center",
"inside": null,
"allowOverlap": false,
"style": {
"fontSize": "11px"
}
},
"showInLegend": null,
"turboThreshold": 0,
"stacking": "",
"groupPadding": 0.2,
"centerInCategory": false,
"findNearestPointBy": "x"
}
},
"navigator": {
"enabled": false
},
"scrollbar": {
"enabled": false
},
"rangeSelector": {
"enabled": false,
"inputEnabled": false
},
"legend": {
"enabled": null,
"maxHeight": null,
"align": "center",
"verticalAlign": "bottom",
"layout": "horizontal",
"width": null,
"margin": 12,
"reversed": false
},
"series": [
{
"name": "4CPU 8GB VHP-INTEL 180GB NVMe by Vultr",
"color": "#3AB1F2",
"data": [
{
"x": 898.5545045549637,
"y": 3524.406939555013
},
{
"x": 844.217335512288,
"y": 3152.8886272342525
},
{
"x": 905.9555680226398,
"y": 3484.094392188663
},
{
"x": 858.6981757407932,
"y": 3183.9318999916554
},
{
"x": 905.5076458930378,
"y": 3518.992055670079
},
{
"x": 861.5332473728263,
"y": 3168.2257084990106
},
{
"x": 920.5016591880747,
"y": 3402.9156722123225
},
{
"x": 845.1080005631411,
"y": 3057.7215306376042
},
{
"x": 911.7069296524769,
"y": 3470.8000732801383
},
{
"x": 850.2251640130868,
"y": 3151.857819925118
},
{
"x": 925.8196919015736,
"y": 3522.9164390448386
},
{
"x": 854.7365480554502,
"y": 3192.330118311211
},
{
"x": 921.6225092419725,
"y": 3505.2362379308406
},
{
"x": 852.8448904072075,
"y": 3216.488436947162
},
{
"x": 922.2646168256529,
"y": 3545.944468794303
},
{
"x": 857.1828701928204,
"y": 3251.357185556846
},
{
"x": 899.0915209555058,
"y": 3447.127101743642
},
{
"x": 853.9549608415224,
"y": 3239.8359771374276
},
{
"x": 902.6532841178048,
"y": 3501.200747608099
},
{
"x": 857.6607725251156,
"y": 3173.999898840384
}
]
}
],
"drilldown": {},
"tooltip": {
"enabled": true,
"useHTML": false,
"format": null,
"headerFormat": "",
"pointFormat": "<span style=\"color:{series.color}\">Single</span>: <b>{point.x:.0f}</b><br><span style=\"color:{series.color}\">Multi</span>: <b>{point.y:.0f}</b>",
"footerFormat": "",
"shared": false,
"outside": false,
"valueDecimals": null,
"split": false
},
"annotations": null
},
"hc_type": "chart",
"id": "84396079281605370933154212431829437277"
}
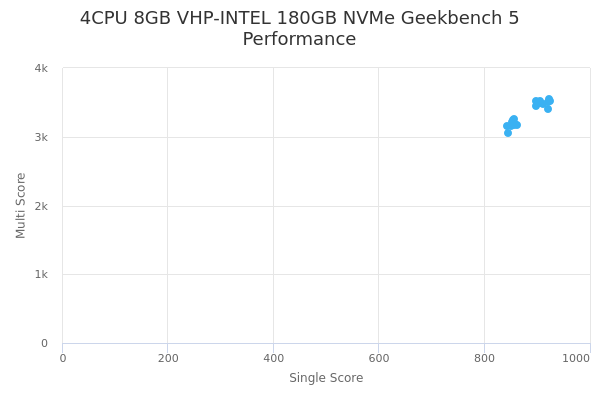
| Single | Multi | |
|---|---|---|
| Max | 926 | 3546 |
| Average | 882 | 3336 |
| Deviation | 29.95 | 163.49 |
| Min | 844 | 3058 |