z1d.xlarge by Amazon Web Services
Geekbench is a cross-platform processor benchmark with a scoring system that determines single-core and multi-core performance using loads simulating real-world scenarios. Geekbench 5 score is calculated with a reference score of 2500 representing the performance of the Intel Core i5-2520M @ 2.50 GHz. The software benchmark is available for Mac OS, Windows, Linux, Android and iOS platforms.
Specifications:
CPU
4
RAM
32.0 GB
Extra
1x
150 GB
NVMe SSD
Net
10000 Mbps
{
"configuration": {
"chart": {
"type": "scatter",
"polar": false,
"zoomType": "",
"options3d": {},
"height": null,
"width": null,
"margin": null,
"inverted": false,
"zooming": {}
},
"credits": {
"enabled": false
},
"title": {
"text": ""
},
"colorAxis": null,
"subtitle": {
"text": ""
},
"xAxis": {
"title": {
"text": [
"Single Score"
],
"useHTML": false,
"style": {
"color": "#666666"
}
},
"categories": null,
"lineWidth": 1,
"tickInterval": null,
"tickWidth": 1,
"tickLength": 10,
"tickPixelInterval": 100,
"plotLines": null,
"labels": {
"enabled": true,
"format": null,
"formatter": "",
"style": {
"color": "#666666",
"cursor": "default",
"fontSize": "11px"
},
"useHTML": false,
"step": 0
},
"plotBands": null,
"visible": true,
"floor": null,
"ceiling": null,
"type": "linear",
"min": 0,
"gridLineWidth": 1,
"gridLineColor": "#e6e6e6",
"minorTickInterval": null,
"minorTickWidth": 0,
"minTickInterval": null,
"startOnTick": true,
"endOnTick": true,
"tickmarkPlacement": 100,
"units": 100,
"minRange": 100
},
"yAxis": {
"title": {
"text": [
"Multi Score"
],
"useHTML": false,
"style": {
"color": "#666666"
}
},
"categories": null,
"plotLines": null,
"plotBands": null,
"lineWidth": null,
"tickInterval": null,
"tickLength": 10,
"floor": null,
"ceiling": null,
"gridLineInterpolation": null,
"gridLineWidth": 1,
"gridLineColor": "#e6e6e6",
"min": 0,
"max": null,
"minorTickInterval": null,
"minorTickWidth": 0,
"minTickInterval": null,
"startOnTick": true,
"endOnTick": true,
"minRange": null,
"type": "linear",
"tickmarkPlacement": null,
"labels": {
"enabled": true,
"formatter": null,
"style": {
"color": "#666666",
"cursor": "default",
"fontSize": "11px"
},
"useHTML": false
}
},
"zAxis": {
"title": {
"text": "Multi Score"
}
},
"plotOptions": {
"series": {
"dataLabels": {
"enabled": false,
"format": null,
"distance": 30,
"align": "center",
"inside": null,
"allowOverlap": false,
"style": {
"fontSize": "11px"
}
},
"showInLegend": null,
"turboThreshold": 0,
"stacking": "",
"groupPadding": 0.2,
"centerInCategory": false,
"findNearestPointBy": "x"
}
},
"navigator": {
"enabled": false
},
"scrollbar": {
"enabled": false
},
"rangeSelector": {
"enabled": false,
"inputEnabled": false
},
"legend": {
"enabled": null,
"maxHeight": null,
"align": "center",
"verticalAlign": "bottom",
"layout": "horizontal",
"width": null,
"margin": 12,
"reversed": false
},
"series": [
{
"name": "z1d.xlarge by Amazon Web Services",
"color": "#f7981d",
"data": [
{
"x": 1104.7294556513182,
"y": 2560.677712289721
},
{
"x": 1088.0370524849166,
"y": 2537.8443003621614
},
{
"x": 1105.9550395024153,
"y": 2564.715705574272
},
{
"x": 1096.6705756581698,
"y": 2544.2048764215724
},
{
"x": 1105.6860922575706,
"y": 2563.182376935683
},
{
"x": 1091.8074207013601,
"y": 2534.8335336338987
},
{
"x": 1101.456656162155,
"y": 2571.968252773109
},
{
"x": 1085.3196713053235,
"y": 2542.7437456939942
},
{
"x": 1109.1352526573874,
"y": 2566.1470264172617
},
{
"x": 1092.8021468193208,
"y": 2546.476154718972
},
{
"x": 1104.8011018863817,
"y": 2571.648157636238
},
{
"x": 1089.4591104742626,
"y": 2533.7632129304457
},
{
"x": 1106.722990698242,
"y": 2564.000072566638
},
{
"x": 1094.7297353922283,
"y": 2543.4875719295824
},
{
"x": 1108.0791346284273,
"y": 2559.514177574867
},
{
"x": 1092.3331934239748,
"y": 2538.832920279676
},
{
"x": 1105.6232981417522,
"y": 2559.899449379664
},
{
"x": 1077.1217258748043,
"y": 2535.5887633823045
},
{
"x": 1106.7984649731427,
"y": 2569.9303944777216
},
{
"x": 1092.6355879329228,
"y": 2540.008430656072
},
{
"x": 1062.0461758694219,
"y": 2466.346247395548
},
{
"x": 1063.7461298316257,
"y": 2461.777950341686
},
{
"x": 1062.6376378443072,
"y": 2463.4451582667
},
{
"x": 1059.317618290765,
"y": 2463.6058905848104
},
{
"x": 1070.9036764883333,
"y": 2472.4751810543135
},
{
"x": 1069.9303225473675,
"y": 2454.212632487295
}
]
}
],
"drilldown": {},
"tooltip": {
"enabled": true,
"useHTML": false,
"format": null,
"headerFormat": "",
"pointFormat": "<span style=\"color:{series.color}\">Single</span>: <b>{point.x:.0f}</b><br><span style=\"color:{series.color}\">Multi</span>: <b>{point.y:.0f}</b>",
"footerFormat": "",
"shared": false,
"outside": false,
"valueDecimals": null,
"split": false
},
"annotations": null
},
"hc_type": "chart",
"id": "249941181189217343114329162949168133424"
}
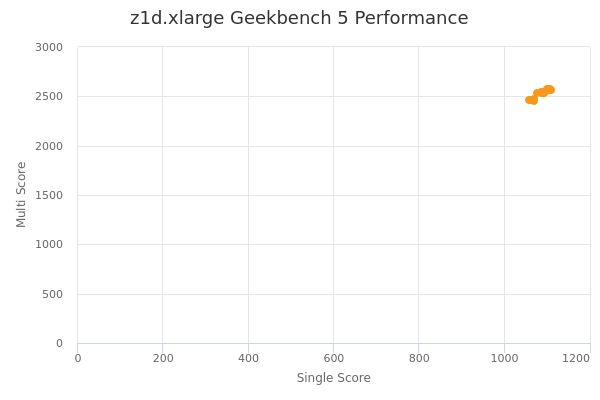
| Single | Multi | |
|---|---|---|
| Max | 1109 | 2572 |
| Average | 1090 | 2532 |
| Deviation | 16.14 | 39.31 |
| Min | 1059 | 2454 |
Sign up as Freemium to get more insight.
- In same series
- z1d.large
- z1d.xlarge
- z1d.2xlarge
- z1d.3xlarge
- z1d.6xlarge
- z1d.12xlarge
- z1d.metal