z1d.large by Amazon Web Services
Geekbench is a cross-platform processor benchmark with a scoring system that determines single-core and multi-core performance using loads simulating real-world scenarios. Geekbench 5 score is calculated with a reference score of 2500 representing the performance of the Intel Core i5-2520M @ 2.50 GHz. The software benchmark is available for Mac OS, Windows, Linux, Android and iOS platforms.
Specifications:
CPU
2
RAM
16.0 GB
Extra
1x
75 GB
NVMe SSD
Net
10000 Mbps
{
"configuration": {
"chart": {
"type": "scatter",
"polar": false,
"zoomType": "",
"options3d": {},
"height": null,
"width": null,
"margin": null,
"inverted": false,
"zooming": {}
},
"credits": {
"enabled": false
},
"title": {
"text": ""
},
"colorAxis": null,
"subtitle": {
"text": ""
},
"xAxis": {
"title": {
"text": [
"Single Score"
],
"useHTML": false,
"style": {
"color": "#666666"
}
},
"categories": null,
"lineWidth": 1,
"tickInterval": null,
"tickWidth": 1,
"tickLength": 10,
"tickPixelInterval": 100,
"plotLines": null,
"labels": {
"enabled": true,
"format": null,
"formatter": "",
"style": {
"color": "#666666",
"cursor": "default",
"fontSize": "11px"
},
"useHTML": false,
"step": 0
},
"plotBands": null,
"visible": true,
"floor": null,
"ceiling": null,
"type": "linear",
"min": 0,
"gridLineWidth": 1,
"gridLineColor": "#e6e6e6",
"minorTickInterval": null,
"minorTickWidth": 0,
"minTickInterval": null,
"startOnTick": true,
"endOnTick": true,
"tickmarkPlacement": 100,
"units": 100,
"minRange": 100
},
"yAxis": {
"title": {
"text": [
"Multi Score"
],
"useHTML": false,
"style": {
"color": "#666666"
}
},
"categories": null,
"plotLines": null,
"plotBands": null,
"lineWidth": null,
"tickInterval": null,
"tickLength": 10,
"floor": null,
"ceiling": null,
"gridLineInterpolation": null,
"gridLineWidth": 1,
"gridLineColor": "#e6e6e6",
"min": 0,
"max": null,
"minorTickInterval": null,
"minorTickWidth": 0,
"minTickInterval": null,
"startOnTick": true,
"endOnTick": true,
"minRange": null,
"type": "linear",
"tickmarkPlacement": null,
"labels": {
"enabled": true,
"formatter": null,
"style": {
"color": "#666666",
"cursor": "default",
"fontSize": "11px"
},
"useHTML": false
}
},
"zAxis": {
"title": {
"text": "Multi Score"
}
},
"plotOptions": {
"series": {
"dataLabels": {
"enabled": false,
"format": null,
"distance": 30,
"align": "center",
"inside": null,
"allowOverlap": false,
"style": {
"fontSize": "11px"
}
},
"showInLegend": null,
"turboThreshold": 0,
"stacking": "",
"groupPadding": 0.2,
"centerInCategory": false,
"findNearestPointBy": "x"
}
},
"navigator": {
"enabled": false
},
"scrollbar": {
"enabled": false
},
"rangeSelector": {
"enabled": false,
"inputEnabled": false
},
"legend": {
"enabled": null,
"maxHeight": null,
"align": "center",
"verticalAlign": "bottom",
"layout": "horizontal",
"width": null,
"margin": 12,
"reversed": false
},
"series": [
{
"name": "z1d.large by Amazon Web Services",
"color": "#f7981d",
"data": [
{
"x": 1086.4660474440204,
"y": 1285.886500903409
},
{
"x": 1083.0393103039373,
"y": 1288.5820784417047
},
{
"x": 1086.70744429013,
"y": 1295.8846507997705
},
{
"x": 1091.1179103464087,
"y": 1298.0747852604652
},
{
"x": 1089.001325852679,
"y": 1301.727122003432
},
{
"x": 1096.4331657157336,
"y": 1298.2930390348101
},
{
"x": 1076.6239190003344,
"y": 1283.0089409435013
},
{
"x": 1086.9002430854998,
"y": 1301.0175453314928
},
{
"x": 1079.1745593132628,
"y": 1308.6504722875804
},
{
"x": 1097.1546180275423,
"y": 1305.8118399781602
},
{
"x": 1077.8009193023893,
"y": 1300.2508789318645
},
{
"x": 1097.101179510773,
"y": 1305.5876832542624
},
{
"x": 1086.0355515952238,
"y": 1308.3334939583142
},
{
"x": 1099.5980236515818,
"y": 1297.381977366783
},
{
"x": 1085.9479806451825,
"y": 1301.049507471872
},
{
"x": 1101.0313752330976,
"y": 1307.872420970674
},
{
"x": 1093.0686115316828,
"y": 1300.4967684620242
},
{
"x": 1096.3443816807835,
"y": 1311.4802639684408
},
{
"x": 1076.4436783407295,
"y": 1292.977865890669
},
{
"x": 1098.4696388129498,
"y": 1296.489225260809
},
{
"x": 1076.7267897184806,
"y": 1293.4512981917828
},
{
"x": 1096.6071601942776,
"y": 1304.8356855982124
},
{
"x": 1083.3419638453406,
"y": 1297.7466368351959
}
]
}
],
"drilldown": {},
"tooltip": {
"enabled": true,
"useHTML": false,
"format": null,
"headerFormat": "",
"pointFormat": "<span style=\"color:{series.color}\">Single</span>: <b>{point.x:.0f}</b><br><span style=\"color:{series.color}\">Multi</span>: <b>{point.y:.0f}</b>",
"footerFormat": "",
"shared": false,
"outside": false,
"valueDecimals": null,
"split": false
},
"annotations": null
},
"hc_type": "chart",
"id": "205304119319566378996348214820226786238"
}
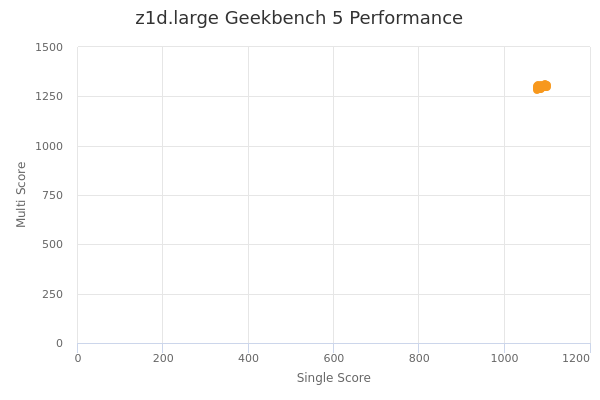
| Single | Multi | |
|---|---|---|
| Max | 1101 | 1311 |
| Average | 1089 | 1299 |
| Deviation | 7.94 | 7.16 |
| Min | 1076 | 1283 |
Sign up as Freemium to get more insight.
- In same series
- z1d.large
- z1d.xlarge
- z1d.2xlarge
- z1d.3xlarge
- z1d.6xlarge
- z1d.12xlarge
- z1d.metal