z1d.2xlarge by Amazon Web Services
Geekbench is a cross-platform processor benchmark with a scoring system that determines single-core and multi-core performance using loads simulating real-world scenarios. Geekbench 5 score is calculated with a reference score of 2500 representing the performance of the Intel Core i5-2520M @ 2.50 GHz. The software benchmark is available for Mac OS, Windows, Linux, Android and iOS platforms.
Specifications:
CPU
8
RAM
64.0 GB
Extra
1x
300 GB
NVMe SSD
Net
10000 Mbps
{
"configuration": {
"chart": {
"type": "scatter",
"polar": false,
"zoomType": "",
"options3d": {},
"height": null,
"width": null,
"margin": null,
"inverted": false,
"zooming": {}
},
"credits": {
"enabled": false
},
"title": {
"text": ""
},
"colorAxis": null,
"subtitle": {
"text": ""
},
"xAxis": {
"title": {
"text": [
"Single Score"
],
"useHTML": false,
"style": {
"color": "#666666"
}
},
"categories": null,
"lineWidth": 1,
"tickInterval": null,
"tickWidth": 1,
"tickLength": 10,
"tickPixelInterval": 100,
"plotLines": null,
"labels": {
"enabled": true,
"format": null,
"formatter": "",
"style": {
"color": "#666666",
"cursor": "default",
"fontSize": "11px"
},
"useHTML": false,
"step": 0
},
"plotBands": null,
"visible": true,
"floor": null,
"ceiling": null,
"type": "linear",
"min": 0,
"gridLineWidth": 1,
"gridLineColor": "#e6e6e6",
"minorTickInterval": null,
"minorTickWidth": 0,
"minTickInterval": null,
"startOnTick": true,
"endOnTick": true,
"tickmarkPlacement": 100,
"units": 100,
"minRange": 100
},
"yAxis": {
"title": {
"text": [
"Multi Score"
],
"useHTML": false,
"style": {
"color": "#666666"
}
},
"categories": null,
"plotLines": null,
"plotBands": null,
"lineWidth": null,
"tickInterval": null,
"tickLength": 10,
"floor": null,
"ceiling": null,
"gridLineInterpolation": null,
"gridLineWidth": 1,
"gridLineColor": "#e6e6e6",
"min": 0,
"max": null,
"minorTickInterval": null,
"minorTickWidth": 0,
"minTickInterval": null,
"startOnTick": true,
"endOnTick": true,
"minRange": null,
"type": "linear",
"tickmarkPlacement": null,
"labels": {
"enabled": true,
"formatter": null,
"style": {
"color": "#666666",
"cursor": "default",
"fontSize": "11px"
},
"useHTML": false
}
},
"zAxis": {
"title": {
"text": "Multi Score"
}
},
"plotOptions": {
"series": {
"dataLabels": {
"enabled": false,
"format": null,
"distance": 30,
"align": "center",
"inside": null,
"allowOverlap": false,
"style": {
"fontSize": "11px"
}
},
"showInLegend": null,
"turboThreshold": 0,
"stacking": "",
"groupPadding": 0.2,
"centerInCategory": false,
"findNearestPointBy": "x"
}
},
"navigator": {
"enabled": false
},
"scrollbar": {
"enabled": false
},
"rangeSelector": {
"enabled": false,
"inputEnabled": false
},
"legend": {
"enabled": null,
"maxHeight": null,
"align": "center",
"verticalAlign": "bottom",
"layout": "horizontal",
"width": null,
"margin": 12,
"reversed": false
},
"series": [
{
"name": "z1d.2xlarge by Amazon Web Services",
"color": "#f7981d",
"data": [
{
"x": 1092.9967725584418,
"y": 4994.436988239432
},
{
"x": 1078.9396104285108,
"y": 4989.612193576331
},
{
"x": 1086.9263198062217,
"y": 4986.769766542049
},
{
"x": 1087.708002490571,
"y": 5002.4557685836535
},
{
"x": 1091.9829700056239,
"y": 4998.776538055514
},
{
"x": 1086.8866541870866,
"y": 5007.288764362688
},
{
"x": 1084.0726702623895,
"y": 4999.64358937605
},
{
"x": 1084.6595155893974,
"y": 4971.143365156382
},
{
"x": 1086.9439080048917,
"y": 4981.260052973439
},
{
"x": 1085.8553858477449,
"y": 4990.182865229314
},
{
"x": 1087.2878538959567,
"y": 5007.457845545246
},
{
"x": 1085.6032294818365,
"y": 4977.196848629021
},
{
"x": 1075.404324849486,
"y": 5006.394454886931
},
{
"x": 1082.034309158361,
"y": 4982.839063787475
},
{
"x": 1085.0686705445205,
"y": 4999.106629481843
},
{
"x": 1084.0556425953905,
"y": 4983.533308696195
},
{
"x": 1094.595614333868,
"y": 4996.06597870845
},
{
"x": 1082.377881033653,
"y": 4997.051317134883
},
{
"x": 1091.231895969575,
"y": 4986.929274841827
},
{
"x": 1081.542161429472,
"y": 5006.853075360062
},
{
"x": 1099.0702305137916,
"y": 4964.936710755732
},
{
"x": 1048.5115996230434,
"y": 4880.930368152592
},
{
"x": 1101.3586172701846,
"y": 4978.58007412093
},
{
"x": 1057.9267587012487,
"y": 4881.70024362832
},
{
"x": 1098.7479239389754,
"y": 4969.063623771129
},
{
"x": 1060.714951368027,
"y": 4868.264745644605
}
]
}
],
"drilldown": {},
"tooltip": {
"enabled": true,
"useHTML": false,
"format": null,
"headerFormat": "",
"pointFormat": "<span style=\"color:{series.color}\">Single</span>: <b>{point.x:.0f}</b><br><span style=\"color:{series.color}\">Multi</span>: <b>{point.y:.0f}</b>",
"footerFormat": "",
"shared": false,
"outside": false,
"valueDecimals": null,
"split": false
},
"annotations": null
},
"hc_type": "chart",
"id": "282137577683648231996570044111496950117"
}
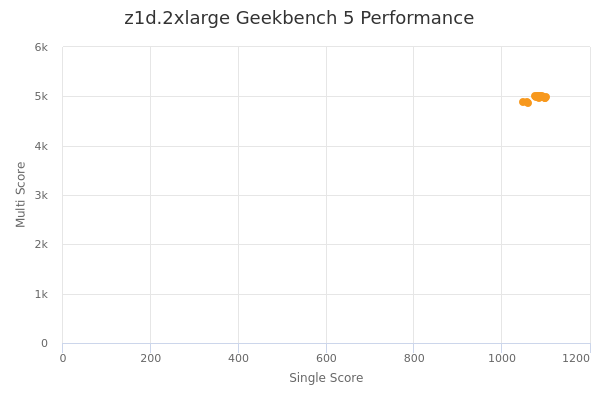
| Single | Multi | |
|---|---|---|
| Max | 1101 | 5007 |
| Average | 1084 | 4977 |
| Deviation | 11.94 | 38.13 |
| Min | 1049 | 4868 |
Sign up as Freemium to get more insight.
- In same series
- z1d.large
- z1d.xlarge
- z1d.2xlarge
- z1d.3xlarge
- z1d.6xlarge
- z1d.12xlarge
- z1d.metal