z1d.6xlarge by Amazon Web Services
Geekbench is a cross-platform processor benchmark with a scoring system that determines single-core and multi-core performance using loads simulating real-world scenarios. Geekbench 5 score is calculated with a reference score of 2500 representing the performance of the Intel Core i5-2520M @ 2.50 GHz. The software benchmark is available for Mac OS, Windows, Linux, Android and iOS platforms.
Specifications:
CPU
24
RAM
192.0 GB
Extra
1x
900 GB
NVMe SSD
Net
10000 Mbps
{
"configuration": {
"chart": {
"type": "scatter",
"polar": false,
"zoomType": "",
"options3d": {},
"height": null,
"width": null,
"margin": null,
"inverted": false,
"zooming": {}
},
"credits": {
"enabled": false
},
"title": {
"text": ""
},
"colorAxis": null,
"subtitle": {
"text": ""
},
"xAxis": {
"title": {
"text": [
"Single Score"
],
"useHTML": false,
"style": {
"color": "#666666"
}
},
"categories": null,
"lineWidth": 1,
"tickInterval": null,
"tickWidth": 1,
"tickLength": 10,
"tickPixelInterval": 100,
"plotLines": null,
"labels": {
"enabled": true,
"format": null,
"formatter": "",
"style": {
"color": "#666666",
"cursor": "default",
"fontSize": "11px"
},
"useHTML": false,
"step": 0
},
"plotBands": null,
"visible": true,
"floor": null,
"ceiling": null,
"type": "linear",
"min": 0,
"gridLineWidth": 1,
"gridLineColor": "#e6e6e6",
"minorTickInterval": null,
"minorTickWidth": 0,
"minTickInterval": null,
"startOnTick": true,
"endOnTick": true,
"tickmarkPlacement": 100,
"units": 100,
"minRange": 100
},
"yAxis": {
"title": {
"text": [
"Multi Score"
],
"useHTML": false,
"style": {
"color": "#666666"
}
},
"categories": null,
"plotLines": null,
"plotBands": null,
"lineWidth": null,
"tickInterval": null,
"tickLength": 10,
"floor": null,
"ceiling": null,
"gridLineInterpolation": null,
"gridLineWidth": 1,
"gridLineColor": "#e6e6e6",
"min": 0,
"max": null,
"minorTickInterval": null,
"minorTickWidth": 0,
"minTickInterval": null,
"startOnTick": true,
"endOnTick": true,
"minRange": null,
"type": "linear",
"tickmarkPlacement": null,
"labels": {
"enabled": true,
"formatter": null,
"style": {
"color": "#666666",
"cursor": "default",
"fontSize": "11px"
},
"useHTML": false
}
},
"zAxis": {
"title": {
"text": "Multi Score"
}
},
"plotOptions": {
"series": {
"dataLabels": {
"enabled": false,
"format": null,
"distance": 30,
"align": "center",
"inside": null,
"allowOverlap": false,
"style": {
"fontSize": "11px"
}
},
"showInLegend": null,
"turboThreshold": 0,
"stacking": "",
"groupPadding": 0.2,
"centerInCategory": false,
"findNearestPointBy": "x"
}
},
"navigator": {
"enabled": false
},
"scrollbar": {
"enabled": false
},
"rangeSelector": {
"enabled": false,
"inputEnabled": false
},
"legend": {
"enabled": null,
"maxHeight": null,
"align": "center",
"verticalAlign": "bottom",
"layout": "horizontal",
"width": null,
"margin": 12,
"reversed": false
},
"series": [
{
"name": "z1d.6xlarge by Amazon Web Services",
"color": "#f7981d",
"data": [
{
"x": 1119.2986427594858,
"y": 13721.357314602783
},
{
"x": 1117.519839651431,
"y": 13676.654853058506
},
{
"x": 1122.3689794573456,
"y": 13724.942388423648
},
{
"x": 1120.2995475860093,
"y": 13705.83801062833
},
{
"x": 1116.4797177864593,
"y": 13607.508115613455
},
{
"x": 1115.8124859672153,
"y": 13619.59250790567
},
{
"x": 1117.621940647573,
"y": 13663.944407693687
},
{
"x": 1114.7348488214543,
"y": 13713.855064637122
},
{
"x": 1114.6751243614844,
"y": 13768.183288676955
},
{
"x": 1120.966154917,
"y": 13764.462882922391
},
{
"x": 1121.270869913883,
"y": 13715.073933924607
},
{
"x": 1119.3838310363283,
"y": 13700.663616565369
},
{
"x": 1120.8542126549878,
"y": 13636.638664401888
},
{
"x": 1115.7344168446484,
"y": 13712.130728463391
},
{
"x": 1120.3688749419512,
"y": 13721.399613629834
},
{
"x": 1113.072134072291,
"y": 13739.379066659292
},
{
"x": 1121.8305909764192,
"y": 13658.363749140066
},
{
"x": 1115.607092765132,
"y": 13692.168217120088
},
{
"x": 1120.7467301961672,
"y": 13771.67553140955
},
{
"x": 1120.359686368156,
"y": 13712.713733059838
}
]
}
],
"drilldown": {},
"tooltip": {
"enabled": true,
"useHTML": false,
"format": null,
"headerFormat": "",
"pointFormat": "<span style=\"color:{series.color}\">Single</span>: <b>{point.x:.0f}</b><br><span style=\"color:{series.color}\">Multi</span>: <b>{point.y:.0f}</b>",
"footerFormat": "",
"shared": false,
"outside": false,
"valueDecimals": null,
"split": false
},
"annotations": null
},
"hc_type": "chart",
"id": "207395006628260935898036737184141788301"
}
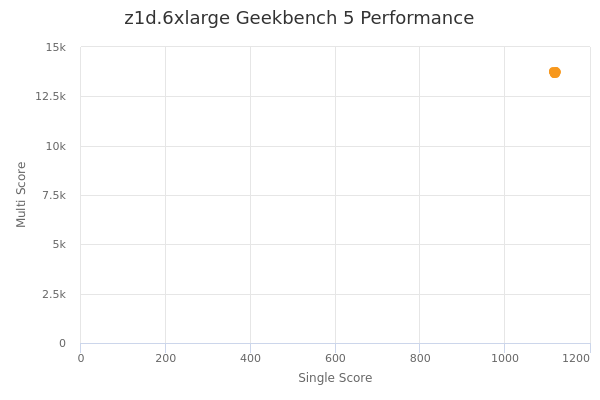
| Single | Multi | |
|---|---|---|
| Max | 1122 | 13772 |
| Average | 1118 | 13701 |
| Deviation | 2.73 | 44.96 |
| Min | 1113 | 13608 |
Sign up as Freemium to get more insight.
- In same series
- z1d.large
- z1d.xlarge
- z1d.2xlarge
- z1d.3xlarge
- z1d.6xlarge
- z1d.12xlarge
- z1d.metal