z1d.12xlarge by Amazon Web Services
Geekbench is a cross-platform processor benchmark with a scoring system that determines single-core and multi-core performance using loads simulating real-world scenarios. Geekbench 5 score is calculated with a reference score of 2500 representing the performance of the Intel Core i5-2520M @ 2.50 GHz. The software benchmark is available for Mac OS, Windows, Linux, Android and iOS platforms.
Specifications:
CPU
48
RAM
384.0 GB
Extra
2x
900 GB
NVMe SSD
Net
25000 Mbps
{
"configuration": {
"chart": {
"type": "scatter",
"polar": false,
"zoomType": "",
"options3d": {},
"height": null,
"width": null,
"margin": null,
"inverted": false,
"zooming": {}
},
"credits": {
"enabled": false
},
"title": {
"text": ""
},
"colorAxis": null,
"subtitle": {
"text": ""
},
"xAxis": {
"title": {
"text": [
"Single Score"
],
"useHTML": false,
"style": {
"color": "#666666"
}
},
"categories": null,
"lineWidth": 1,
"tickInterval": null,
"tickWidth": 1,
"tickLength": 10,
"tickPixelInterval": 100,
"plotLines": null,
"labels": {
"enabled": true,
"format": null,
"formatter": "",
"style": {
"color": "#666666",
"cursor": "default",
"fontSize": "11px"
},
"useHTML": false,
"step": 0
},
"plotBands": null,
"visible": true,
"floor": null,
"ceiling": null,
"type": "linear",
"min": 0,
"gridLineWidth": 1,
"gridLineColor": "#e6e6e6",
"minorTickInterval": null,
"minorTickWidth": 0,
"minTickInterval": null,
"startOnTick": true,
"endOnTick": true,
"tickmarkPlacement": 100,
"units": 100,
"minRange": 100
},
"yAxis": {
"title": {
"text": [
"Multi Score"
],
"useHTML": false,
"style": {
"color": "#666666"
}
},
"categories": null,
"plotLines": null,
"plotBands": null,
"lineWidth": null,
"tickInterval": null,
"tickLength": 10,
"floor": null,
"ceiling": null,
"gridLineInterpolation": null,
"gridLineWidth": 1,
"gridLineColor": "#e6e6e6",
"min": 0,
"max": null,
"minorTickInterval": null,
"minorTickWidth": 0,
"minTickInterval": null,
"startOnTick": true,
"endOnTick": true,
"minRange": null,
"type": "linear",
"tickmarkPlacement": null,
"labels": {
"enabled": true,
"formatter": null,
"style": {
"color": "#666666",
"cursor": "default",
"fontSize": "11px"
},
"useHTML": false
}
},
"zAxis": {
"title": {
"text": "Multi Score"
}
},
"plotOptions": {
"series": {
"dataLabels": {
"enabled": false,
"format": null,
"distance": 30,
"align": "center",
"inside": null,
"allowOverlap": false,
"style": {
"fontSize": "11px"
}
},
"showInLegend": null,
"turboThreshold": 0,
"stacking": "",
"groupPadding": 0.2,
"centerInCategory": false,
"findNearestPointBy": "x"
}
},
"navigator": {
"enabled": false
},
"scrollbar": {
"enabled": false
},
"rangeSelector": {
"enabled": false,
"inputEnabled": false
},
"legend": {
"enabled": null,
"maxHeight": null,
"align": "center",
"verticalAlign": "bottom",
"layout": "horizontal",
"width": null,
"margin": 12,
"reversed": false
},
"series": [
{
"name": "z1d.12xlarge by Amazon Web Services",
"color": "#f7981d",
"data": [
{
"x": 1108.222988399128,
"y": 23541.916267144676
},
{
"x": 1110.8411624684338,
"y": 24132.490295708994
},
{
"x": 1107.7047202706888,
"y": 23573.439058325683
},
{
"x": 1108.4555207223166,
"y": 23493.737941319658
},
{
"x": 1116.6951759340504,
"y": 23618.463263082842
},
{
"x": 1113.3597110153466,
"y": 23453.91283919607
},
{
"x": 1108.2531196773105,
"y": 23827.012521985012
},
{
"x": 1114.2241971336489,
"y": 23806.132915902737
},
{
"x": 1110.8768378561026,
"y": 23953.971275689975
},
{
"x": 1104.9568279160976,
"y": 23221.404840485728
},
{
"x": 1115.3375808215467,
"y": 24083.86390519607
},
{
"x": 1113.7022185133362,
"y": 23949.63349586374
},
{
"x": 1106.385161839569,
"y": 23871.59841224648
},
{
"x": 1112.9514688897043,
"y": 23869.849387715993
},
{
"x": 1106.061648743525,
"y": 24182.03491103476
},
{
"x": 1113.8956286659648,
"y": 24014.73588446405
},
{
"x": 1105.4724182818086,
"y": 24278.31816154941
},
{
"x": 1114.2156631950713,
"y": 23888.749151810465
},
{
"x": 1108.4042697897814,
"y": 23995.73121331325
},
{
"x": 1113.418952198475,
"y": 23420.889936205826
}
]
}
],
"drilldown": {},
"tooltip": {
"enabled": true,
"useHTML": false,
"format": null,
"headerFormat": "",
"pointFormat": "<span style=\"color:{series.color}\">Single</span>: <b>{point.x:.0f}</b><br><span style=\"color:{series.color}\">Multi</span>: <b>{point.y:.0f}</b>",
"footerFormat": "",
"shared": false,
"outside": false,
"valueDecimals": null,
"split": false
},
"annotations": null
},
"hc_type": "chart",
"id": "312289106638663328685827809053611284709"
}
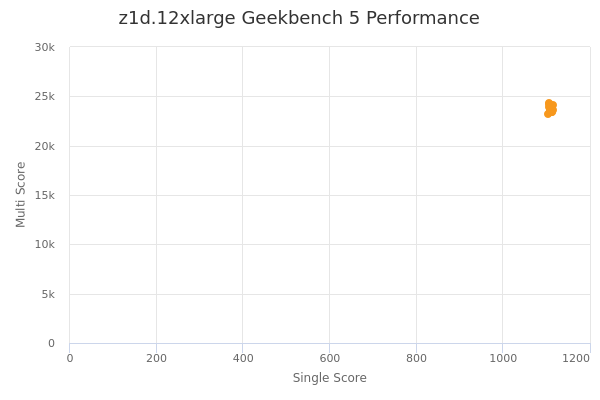
| Single | Multi | |
|---|---|---|
| Max | 1117 | 24278 |
| Average | 1111 | 23809 |
| Deviation | 3.56 | 278.96 |
| Min | 1105 | 23221 |
Sign up as Freemium to get more insight.
- In same series
- z1d.large
- z1d.xlarge
- z1d.2xlarge
- z1d.3xlarge
- z1d.6xlarge
- z1d.12xlarge
- z1d.metal