r6id.xlarge by Amazon Web Services
Geekbench is a cross-platform processor benchmark with a scoring system that determines single-core and multi-core performance using loads simulating real-world scenarios. Geekbench 5 score is calculated with a reference score of 2500 representing the performance of the Intel Core i5-2520M @ 2.50 GHz. The software benchmark is available for Mac OS, Windows, Linux, Android and iOS platforms.
Specifications:
CPU
4
RAM
32.0 GB
Extra
1x
237 GB
SSD
Net
12000 Mbps
{
"configuration": {
"chart": {
"type": "scatter",
"polar": false,
"zoomType": "",
"options3d": {},
"height": null,
"width": null,
"margin": null,
"inverted": false,
"zooming": {}
},
"credits": {
"enabled": false
},
"title": {
"text": ""
},
"colorAxis": null,
"subtitle": {
"text": ""
},
"xAxis": {
"title": {
"text": [
"Single Score"
],
"useHTML": false,
"style": {
"color": "#666666"
}
},
"categories": null,
"lineWidth": 1,
"tickInterval": null,
"tickWidth": 1,
"tickLength": 10,
"tickPixelInterval": 100,
"plotLines": null,
"labels": {
"enabled": true,
"format": null,
"formatter": "",
"style": {
"color": "#666666",
"cursor": "default",
"fontSize": "11px"
},
"useHTML": false,
"step": 0
},
"plotBands": null,
"visible": true,
"floor": null,
"ceiling": null,
"type": "linear",
"min": 0,
"gridLineWidth": 1,
"gridLineColor": "#e6e6e6",
"minorTickInterval": null,
"minorTickWidth": 0,
"minTickInterval": null,
"startOnTick": true,
"endOnTick": true,
"tickmarkPlacement": 100,
"units": 100,
"minRange": 100
},
"yAxis": {
"title": {
"text": [
"Multi Score"
],
"useHTML": false,
"style": {
"color": "#666666"
}
},
"categories": null,
"plotLines": null,
"plotBands": null,
"lineWidth": null,
"tickInterval": null,
"tickLength": 10,
"floor": null,
"ceiling": null,
"gridLineInterpolation": null,
"gridLineWidth": 1,
"gridLineColor": "#e6e6e6",
"min": 0,
"max": null,
"minorTickInterval": null,
"minorTickWidth": 0,
"minTickInterval": null,
"startOnTick": true,
"endOnTick": true,
"minRange": null,
"type": "linear",
"tickmarkPlacement": null,
"labels": {
"enabled": true,
"formatter": null,
"style": {
"color": "#666666",
"cursor": "default",
"fontSize": "11px"
},
"useHTML": false
}
},
"zAxis": {
"title": {
"text": "Multi Score"
}
},
"plotOptions": {
"series": {
"dataLabels": {
"enabled": false,
"format": null,
"distance": 30,
"align": "center",
"inside": null,
"allowOverlap": false,
"style": {
"fontSize": "11px"
}
},
"showInLegend": null,
"turboThreshold": 0,
"stacking": "",
"groupPadding": 0.2,
"centerInCategory": false,
"findNearestPointBy": "x"
}
},
"navigator": {
"enabled": false
},
"scrollbar": {
"enabled": false
},
"rangeSelector": {
"enabled": false,
"inputEnabled": false
},
"legend": {
"enabled": null,
"maxHeight": null,
"align": "center",
"verticalAlign": "bottom",
"layout": "horizontal",
"width": null,
"margin": 12,
"reversed": false
},
"series": [
{
"name": "r6id.xlarge by Amazon Web Services",
"color": "#f7981d",
"data": [
{
"x": 1204.9237419902668,
"y": 2760.559957654648
},
{
"x": 1196.044165458419,
"y": 2736.681967711641
},
{
"x": 1206.9058297405193,
"y": 2783.6331390288574
},
{
"x": 1199.2629328225846,
"y": 2755.259431293436
},
{
"x": 1207.4745848154434,
"y": 2768.0137087702665
},
{
"x": 1198.8772357745563,
"y": 2750.964061600469
},
{
"x": 1216.846730644376,
"y": 2739.028039497537
},
{
"x": 1194.4195916549804,
"y": 2755.2775285426037
},
{
"x": 1217.6380028262856,
"y": 2763.4359269340443
},
{
"x": 1201.0585081246975,
"y": 2741.861691164693
},
{
"x": 1209.8419415489975,
"y": 2769.3569870046254
},
{
"x": 1195.7563241704772,
"y": 2785.0928835152067
},
{
"x": 1212.4504047379319,
"y": 2765.9122024919084
},
{
"x": 1223.3845478114013,
"y": 2768.2005087116045
},
{
"x": 1214.9097839954097,
"y": 2767.955517326841
},
{
"x": 1201.4187517222058,
"y": 2776.2636763208957
},
{
"x": 1213.6234839581018,
"y": 2749.0949002758316
},
{
"x": 1222.9534607310366,
"y": 2773.114003026272
},
{
"x": 1238.6239762634514,
"y": 2792.4835416827436
},
{
"x": 1171.8988328996452,
"y": 2748.4587204053737
},
{
"x": 1243.3682575481719,
"y": 2809.4835475971377
},
{
"x": 1180.903322916322,
"y": 2736.2666997297483
},
{
"x": 1225.4021742803159,
"y": 2805.4445812524687
},
{
"x": 1202.2246140427815,
"y": 2730.823106587234
},
{
"x": 1226.3412615187463,
"y": 2748.98262396892
},
{
"x": 1195.0221254459134,
"y": 2714.820513194531
},
{
"x": 1198.082617989831,
"y": 2768.928344122781
},
{
"x": 1198.946825468473,
"y": 2741.9194164251976
},
{
"x": 1205.2697037289277,
"y": 2759.6239117746945
},
{
"x": 1159.128951926386,
"y": 2736.571629906693
},
{
"x": 1218.2733579957849,
"y": 2781.6309083897654
},
{
"x": 1213.907188451772,
"y": 2760.247379500807
},
{
"x": 1236.1003457681243,
"y": 2788.115447921188
},
{
"x": 1216.7443439536505,
"y": 2738.994107777619
},
{
"x": 1224.884373225838,
"y": 2794.6930648543903
},
{
"x": 1187.080130733881,
"y": 2746.97595425113
},
{
"x": 1223.9551934305139,
"y": 2787.556200563101
},
{
"x": 1202.3674491553963,
"y": 2740.494974065606
},
{
"x": 1233.5627530202023,
"y": 2779.7850365800614
},
{
"x": 1189.1981654467602,
"y": 2718.1149545365024
}
]
}
],
"drilldown": {},
"tooltip": {
"enabled": true,
"useHTML": false,
"format": null,
"headerFormat": "",
"pointFormat": "<span style=\"color:{series.color}\">Single</span>: <b>{point.x:.0f}</b><br><span style=\"color:{series.color}\">Multi</span>: <b>{point.y:.0f}</b>",
"footerFormat": "",
"shared": false,
"outside": false,
"valueDecimals": null,
"split": false
},
"annotations": null
},
"hc_type": "chart",
"id": "276174816600900264543166748674183226378"
}
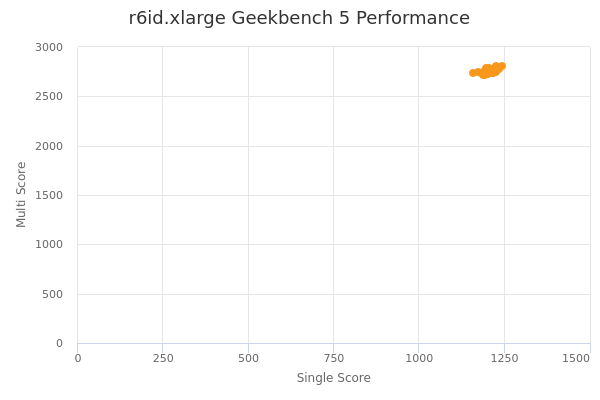
| Single | Multi | |
|---|---|---|
| Max | 1243 | 2809 |
| Average | 1208 | 2761 |
| Deviation | 17.42 | 22.40 |
| Min | 1159 | 2715 |
Sign up as Freemium to get more insight.