r6id.32xlarge by Amazon Web Services
Geekbench is a cross-platform processor benchmark with a scoring system that determines single-core and multi-core performance using loads simulating real-world scenarios. Geekbench 5 score is calculated with a reference score of 2500 representing the performance of the Intel Core i5-2520M @ 2.50 GHz. The software benchmark is available for Mac OS, Windows, Linux, Android and iOS platforms.
Specifications:
CPU
128
RAM
1024.0 GB
Extra
4x
1900 GB
SSD
Net
50000 Mbps
{
"configuration": {
"chart": {
"type": "scatter",
"polar": false,
"zoomType": "",
"options3d": {},
"height": null,
"width": null,
"margin": null,
"inverted": false,
"zooming": {}
},
"credits": {
"enabled": false
},
"title": {
"text": ""
},
"colorAxis": null,
"subtitle": {
"text": ""
},
"xAxis": {
"title": {
"text": [
"Single Score"
],
"useHTML": false,
"style": {
"color": "#666666"
}
},
"categories": null,
"lineWidth": 1,
"tickInterval": null,
"tickWidth": 1,
"tickLength": 10,
"tickPixelInterval": 100,
"plotLines": null,
"labels": {
"enabled": true,
"format": null,
"formatter": "",
"style": {
"color": "#666666",
"cursor": "default",
"fontSize": "11px"
},
"useHTML": false,
"step": 0
},
"plotBands": null,
"visible": true,
"floor": null,
"ceiling": null,
"type": "linear",
"min": 0,
"gridLineWidth": 1,
"gridLineColor": "#e6e6e6",
"minorTickInterval": null,
"minorTickWidth": 0,
"minTickInterval": null,
"startOnTick": true,
"endOnTick": true,
"tickmarkPlacement": 100,
"units": 100,
"minRange": 100
},
"yAxis": {
"title": {
"text": [
"Multi Score"
],
"useHTML": false,
"style": {
"color": "#666666"
}
},
"categories": null,
"plotLines": null,
"plotBands": null,
"lineWidth": null,
"tickInterval": null,
"tickLength": 10,
"floor": null,
"ceiling": null,
"gridLineInterpolation": null,
"gridLineWidth": 1,
"gridLineColor": "#e6e6e6",
"min": 0,
"max": null,
"minorTickInterval": null,
"minorTickWidth": 0,
"minTickInterval": null,
"startOnTick": true,
"endOnTick": true,
"minRange": null,
"type": "linear",
"tickmarkPlacement": null,
"labels": {
"enabled": true,
"formatter": null,
"style": {
"color": "#666666",
"cursor": "default",
"fontSize": "11px"
},
"useHTML": false
}
},
"zAxis": {
"title": {
"text": "Multi Score"
}
},
"plotOptions": {
"series": {
"dataLabels": {
"enabled": false,
"format": null,
"distance": 30,
"align": "center",
"inside": null,
"allowOverlap": false,
"style": {
"fontSize": "11px"
}
},
"showInLegend": null,
"turboThreshold": 0,
"stacking": "",
"groupPadding": 0.2,
"centerInCategory": false,
"findNearestPointBy": "x"
}
},
"navigator": {
"enabled": false
},
"scrollbar": {
"enabled": false
},
"rangeSelector": {
"enabled": false,
"inputEnabled": false
},
"legend": {
"enabled": null,
"maxHeight": null,
"align": "center",
"verticalAlign": "bottom",
"layout": "horizontal",
"width": null,
"margin": 12,
"reversed": false
},
"series": [
{
"name": "r6id.32xlarge by Amazon Web Services",
"color": "#f7981d",
"data": [
{
"x": 1256.4804241403654,
"y": 51072.70363486571
},
{
"x": 1254.0308042395316,
"y": 52445.89065546299
},
{
"x": 1250.9919028166673,
"y": 50408.4474790871
},
{
"x": 1243.863024786762,
"y": 52441.04003055893
},
{
"x": 1241.6563665777896,
"y": 49031.96243791147
},
{
"x": 1251.3729414326806,
"y": 52152.16182622424
},
{
"x": 1250.3551827517417,
"y": 52477.42715753117
},
{
"x": 1249.4148036150214,
"y": 53009.50929615108
},
{
"x": 1250.3454155186073,
"y": 50446.69914568431
},
{
"x": 1242.3851939178403,
"y": 53053.591773224725
},
{
"x": 1250.3804774973735,
"y": 53477.60235471877
},
{
"x": 1243.0208600297456,
"y": 51381.978142606546
},
{
"x": 1241.5965779603166,
"y": 51896.79960323455
},
{
"x": 1248.752056533297,
"y": 52328.729941683865
},
{
"x": 1242.055304989017,
"y": 52726.671489236454
},
{
"x": 1253.0119608145235,
"y": 52067.52395260748
},
{
"x": 1255.0183130668327,
"y": 52814.27504347998
},
{
"x": 1251.9824172688598,
"y": 52874.38531471485
},
{
"x": 1251.1792371241118,
"y": 51658.127288348696
},
{
"x": 1254.7535007990764,
"y": 52481.85436784788
}
]
}
],
"drilldown": {},
"tooltip": {
"enabled": true,
"useHTML": false,
"format": null,
"headerFormat": "",
"pointFormat": "<span style=\"color:{series.color}\">Single</span>: <b>{point.x:.0f}</b><br><span style=\"color:{series.color}\">Multi</span>: <b>{point.y:.0f}</b>",
"footerFormat": "",
"shared": false,
"outside": false,
"valueDecimals": null,
"split": false
},
"annotations": null
},
"hc_type": "chart",
"id": "106647841403830564214427764927786331336"
}
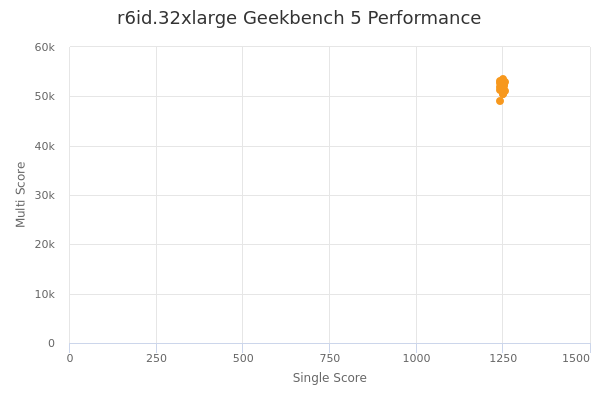
| Single | Multi | |
|---|---|---|
| Max | 1256 | 53478 |
| Average | 1249 | 52012 |
| Deviation | 4.79 | 1057.80 |
| Min | 1242 | 49032 |
Sign up as Freemium to get more insight.