r6id.2xlarge by Amazon Web Services
Geekbench is a cross-platform processor benchmark with a scoring system that determines single-core and multi-core performance using loads simulating real-world scenarios. Geekbench 5 score is calculated with a reference score of 2500 representing the performance of the Intel Core i5-2520M @ 2.50 GHz. The software benchmark is available for Mac OS, Windows, Linux, Android and iOS platforms.
Specifications:
CPU
8
RAM
64.0 GB
Extra
1x
474 GB
SSD
Net
12000 Mbps
{
"configuration": {
"chart": {
"type": "scatter",
"polar": false,
"zoomType": "",
"options3d": {},
"height": null,
"width": null,
"margin": null,
"inverted": false,
"zooming": {}
},
"credits": {
"enabled": false
},
"title": {
"text": ""
},
"colorAxis": null,
"subtitle": {
"text": ""
},
"xAxis": {
"title": {
"text": [
"Single Score"
],
"useHTML": false,
"style": {
"color": "#666666"
}
},
"categories": null,
"lineWidth": 1,
"tickInterval": null,
"tickWidth": 1,
"tickLength": 10,
"tickPixelInterval": 100,
"plotLines": null,
"labels": {
"enabled": true,
"format": null,
"formatter": "",
"style": {
"color": "#666666",
"cursor": "default",
"fontSize": "11px"
},
"useHTML": false,
"step": 0
},
"plotBands": null,
"visible": true,
"floor": null,
"ceiling": null,
"type": "linear",
"min": 0,
"gridLineWidth": 1,
"gridLineColor": "#e6e6e6",
"minorTickInterval": null,
"minorTickWidth": 0,
"minTickInterval": null,
"startOnTick": true,
"endOnTick": true,
"tickmarkPlacement": 100,
"units": 100,
"minRange": 100
},
"yAxis": {
"title": {
"text": [
"Multi Score"
],
"useHTML": false,
"style": {
"color": "#666666"
}
},
"categories": null,
"plotLines": null,
"plotBands": null,
"lineWidth": null,
"tickInterval": null,
"tickLength": 10,
"floor": null,
"ceiling": null,
"gridLineInterpolation": null,
"gridLineWidth": 1,
"gridLineColor": "#e6e6e6",
"min": 0,
"max": null,
"minorTickInterval": null,
"minorTickWidth": 0,
"minTickInterval": null,
"startOnTick": true,
"endOnTick": true,
"minRange": null,
"type": "linear",
"tickmarkPlacement": null,
"labels": {
"enabled": true,
"formatter": null,
"style": {
"color": "#666666",
"cursor": "default",
"fontSize": "11px"
},
"useHTML": false
}
},
"zAxis": {
"title": {
"text": "Multi Score"
}
},
"plotOptions": {
"series": {
"dataLabels": {
"enabled": false,
"format": null,
"distance": 30,
"align": "center",
"inside": null,
"allowOverlap": false,
"style": {
"fontSize": "11px"
}
},
"showInLegend": null,
"turboThreshold": 0,
"stacking": "",
"groupPadding": 0.2,
"centerInCategory": false,
"findNearestPointBy": "x"
}
},
"navigator": {
"enabled": false
},
"scrollbar": {
"enabled": false
},
"rangeSelector": {
"enabled": false,
"inputEnabled": false
},
"legend": {
"enabled": null,
"maxHeight": null,
"align": "center",
"verticalAlign": "bottom",
"layout": "horizontal",
"width": null,
"margin": 12,
"reversed": false
},
"series": [
{
"name": "r6id.2xlarge by Amazon Web Services",
"color": "#f7981d",
"data": [
{
"x": 1245.3045268419348,
"y": 5394.525188969003
},
{
"x": 1171.2135393942388,
"y": 5211.862501246373
},
{
"x": 1250.997844426543,
"y": 5397.015441470204
},
{
"x": 1157.8130997352418,
"y": 5211.382236183199
},
{
"x": 1250.0861308922329,
"y": 5384.018906104425
},
{
"x": 1176.099475346165,
"y": 5210.153158650943
},
{
"x": 1245.1108192131783,
"y": 5360.18737814577
},
{
"x": 1170.0307134271607,
"y": 5254.912590007458
},
{
"x": 1218.7253122843317,
"y": 5368.601138618989
},
{
"x": 1218.5544479556927,
"y": 5195.53833796632
},
{
"x": 1249.7099808924552,
"y": 5336.467688544221
},
{
"x": 1222.813843436788,
"y": 5352.558299715729
},
{
"x": 1212.2745351252522,
"y": 5341.2368728131605
},
{
"x": 1221.0364076382475,
"y": 5340.603797394779
},
{
"x": 1241.444089179881,
"y": 5401.726878344802
},
{
"x": 1232.5291059566368,
"y": 5366.6707394564555
},
{
"x": 1228.3297152185894,
"y": 5381.562049807626
},
{
"x": 1228.6423371460535,
"y": 5259.618701016769
},
{
"x": 1231.3891622523074,
"y": 5372.930741619985
},
{
"x": 1175.4328105083923,
"y": 5162.845250246393
}
]
}
],
"drilldown": {},
"tooltip": {
"enabled": true,
"useHTML": false,
"format": null,
"headerFormat": "",
"pointFormat": "<span style=\"color:{series.color}\">Single</span>: <b>{point.x:.0f}</b><br><span style=\"color:{series.color}\">Multi</span>: <b>{point.y:.0f}</b>",
"footerFormat": "",
"shared": false,
"outside": false,
"valueDecimals": null,
"split": false
},
"annotations": null
},
"hc_type": "chart",
"id": "42321979080236259884091530779872860283"
}
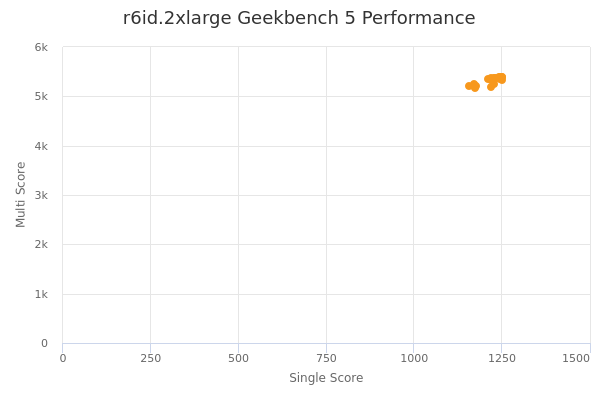
| Single | Multi | |
|---|---|---|
| Max | 1251 | 5402 |
| Average | 1217 | 5315 |
| Deviation | 29.58 | 77.58 |
| Min | 1158 | 5163 |
Sign up as Freemium to get more insight.